
See which countries have been granted the most AI patents each year, from 2012 to 2022.


click for more →


Scan with your phone's camera or QR code app to view
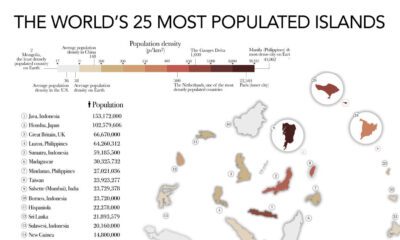

The most populated islands of the earth are teeming hubs of human activity, a far cry from the remote paradises in popular imaginations.
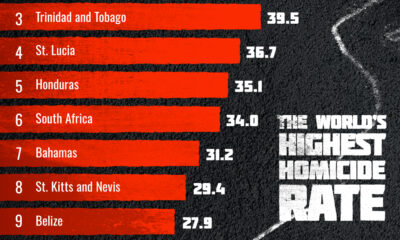

This graphic shows the top 10 most dangerous countries in the world, based on homicide rates per 100,000 people.


In this infographic, we map out internet usage by global region based on the latest data from the World Bank.


Korean brands dominate the U.S. TV market.
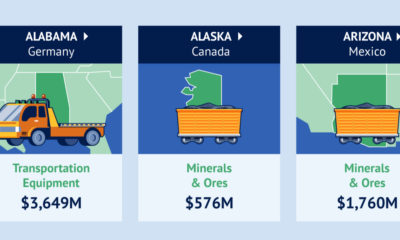

Canada is the top destination for products from 21 states.


As U.S. home prices hit record highs, which housing market is seen the fastest growth? This graphic shows the top 10 across the country.


Compound interest is a powerful force in building wealth. Here's how it impacts even the most modest portfolio over the long term.


North America and East Asia have the speediest internet.


A survey of 600 high net worth individuals revealed there’s one subset of people who are confident of making it in 2024.


We visualize inflation rates across G20 countries as of Feb 2024, in the context of their COVID-19 pandemic peak.
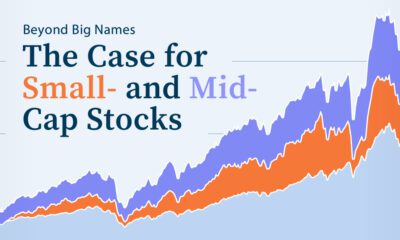

Small- and mid-cap stocks have historically outperformed large caps. What are the opportunities and risks to consider?


Just three countries accounted for 40% of global oil production last year.


In this graphic we rank the top Swiss watch brands, based on their estimated 2023 market share.


This visual heatmap of unemployment claims by state highlights New York, California, and Alaska leading the country by a wide margin.


This graphic compares the nominal vs. inflation-adjusted value of the U.S. minimum wage, from 1940 to 2023.


We look at the world's 10 richest people in finance, from Warren Buffett to Michael Bloomberg, in this visualization.


 Creator Program