
The IMF has released its economic growth forecasts for 2024. How do the G7 and BRICS countries compare?


click for more →


Scan with your phone's camera or QR code app to view


In this graphic, we show the highest earning flight routes globally as air travel continued to rebound in 2023.


Nvidia is coming for Intel’s crown. Samsung is losing ground. AI is transforming the space. We break down revenue for semiconductor companies.


Here's where workers earn the highest minimum wage in America as 22 states implement wage increases in 2024.


The U.S. residential real estate market is worth a staggering $47.5 trillion. Here are the most valuable housing markets in the country.


This chart visualizes the flow of the 80 millions tons of food waste in the United States in 2021, using data from ReFED.


Which of the Big Four accounting firms take home the most audit fees from their S&P 500 clients?


The Nvidia rocket ship is refusing to slow down, leading the pack of strong stock performance for most major U.S. chipmakers.


The expert consensus is that a human-like machine intelligence could emerge by 2059, but what if we could do it in less than half the time?


We compiled the performance of 10 pure play EV stocks into one chart, revealing one company that bucked the broader trend.
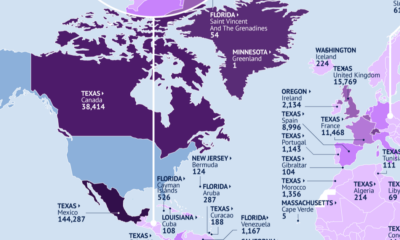

This map identifies the biggest U.S. export markets by state, showing the top partner of each country by value of goods imported.


Listing the many programs—health, defense, veterans benefits—that U.S. federal taxes fund, in the form of a single federal tax dollar.


The country with the most forest loss since 2001 lost as much forest cover as the next four countries combined.


Last year, the share of affordable homes in the U.S. reached its lowest point on record amid high interest rates and soaring home prices.
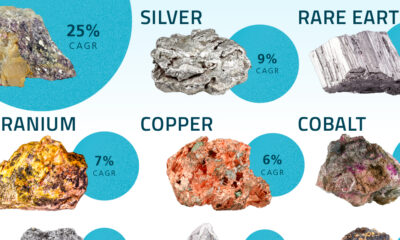

We’ve partnered with Sprott to visualize nine critical minerals for the clean energy transition and their projected compound annual growth rates between 2022–2027.


In this map, we visualize average hourly wages across a variety of European countries, based on data from Eurostat.


While the price of gold has reached new record highs in 2024, gold mining stocks are still far from their 2011 peaks.


By 2050, one in six people will be aged 65 or older. Here, we map the growth of the senior population by region.


 Creator Program