
This graphic highlights France and Canada as the global leaders when it comes to generating carbon tax revenue.


click for more →


Scan with your phone's camera or QR code app to view


The top three economic powerhouses of Africa contribute more than one-third to the African economy. We rank the nations of the world's second-largest continent by 2024...


Despite contributing over half of global GDP, biodiversity is under severe pressure, and key species and ecosystems continue to be lost.


Automakers with models on the most disappointing cars list include: Volkswagen, Kia, Mercedes-Benz, and Nissan.
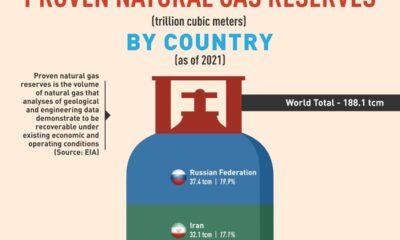

Russia has the biggest reserves, accounting for around 20% of the global total.
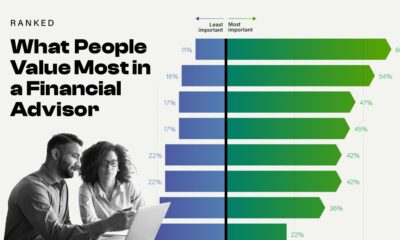

Positive reviews and recommendations are some of the least important factors—so what do people look for in a financial advisor?
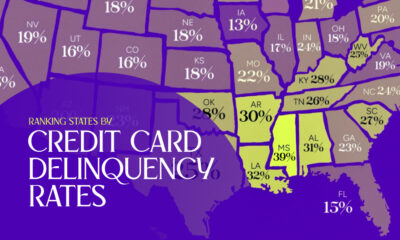

Which states have the lowest credit card delinquency rates in America, and which have the highest?


Nearly half a billion people live on the third-largest continent. We take a closer look in this population map of North America.
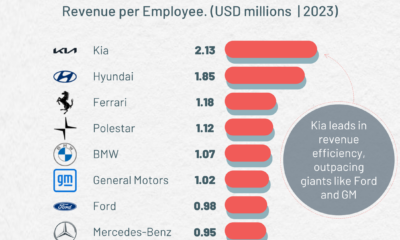

Kia leads in revenue per employee, outpacing other carmakers such as GM and Ford.


The world's three biggest religions have a combined 5 billion followers. We rank the most popular religions, based on recent estimates.
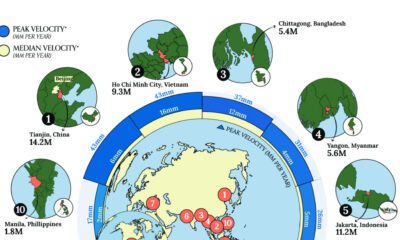

Many major coastal cities are experiencing local land subsidence where underground soil and rock collapse, causing the surface above to sink.


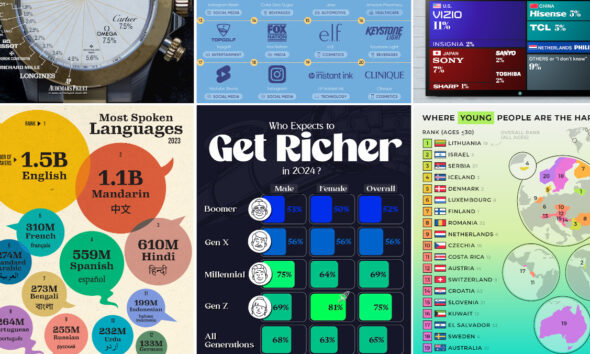
Here are the top languages spoken in the world by number of speakers in 2023.


Data centers produce a staggering amount of heat, but what if instead of treating it as waste, we could harness it instead?
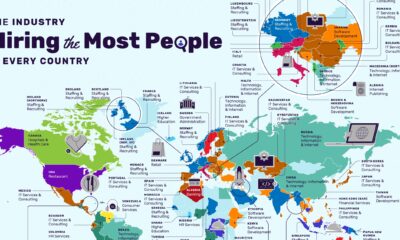

The restaurant industry has the most vacancies in the U.S., followed by non-profit organizations.


Global inflation projections look optimistic in 2024, but risks of a second wave of price pressures remain due to geopolitical shocks.
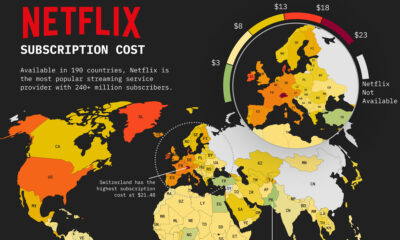

This map of Netflix price by country shows how much a basic subscription package costs around the world.


We chart the ever-widening gap between median incomes and the median price of houses in America, using data from the Federal Reserve from 1984 to 2022.


It's election year around the world, and this map of 2024 global elections by country shows just how many people will be impacted.


 Creator Program