Mapped: Europe’s GDP Per Capita, by Country
The Growth of a $1,000 Equity Investment, by Stock Market
Mapped: The Most Valuable Company in Each Southeast Asian Country
Visualizing Global Inflation Forecasts (2024-2026)
The World’s Fastest Growing Emerging Markets (2024-2029 Forecast)
Mapped: The Number of AI Startups By Country
All of the Grants Given by the U.S. CHIPS Act
Visualizing AI Patents by Country
How Tech Logos Have Evolved Over Time
Ranked: Semiconductor Companies by Industry Revenue Share
Charted: What Frustrates Americans About the Tax System
Ranked: The Top 20 Countries in Debt to China
Charted: Which Country Has the Most Billionaires in 2024?
Charted: Which City Has the Most Billionaires in 2024?
Charted: Who Has Savings in This Economy?
Life Expectancy by Region (1950-2050F)
What Causes Preventable Child Deaths?
The Cost of an EpiPen in Major Markets
Charted: Global Tobacco Use by Country and Sex
Visualized: What Lives in Your Gut Microbiome?
Who’s Building the Most Solar Energy?
Mapped: The Age of Energy Projects in Interconnection Queues, by State
Ranked: The Top 10 EV Battery Manufacturers in 2023
The World’s Biggest Nuclear Energy Producers
The World’s Biggest Oil Producers in 2023
The Largest Earthquakes in the New York Area (1970-2024)
Mapped: Average Wages Across Europe
Mapped: Asia’s Population Patterns by Density
A Map of Global Happiness By Country in 2024
Mapped: Population Growth by Region (1900-2050F)
Visualizing Global Gold Production in 2023
Gold vs. S&P 500: Which Has Grown More Over Five Years?
Charted: The Value Gap Between the Gold Price and Gold Miners
Charted: Global Uranium Reserves, by Country
The Carbon Footprint of Major Travel Methods
Ranking the Top 15 Countries by Carbon Tax Revenue
Ranked: The Countries With the Most Air Pollution in 2023
Top Countries By Forest Growth Since 2001
Ranked: Top Countries by Total Forest Loss Since 2001
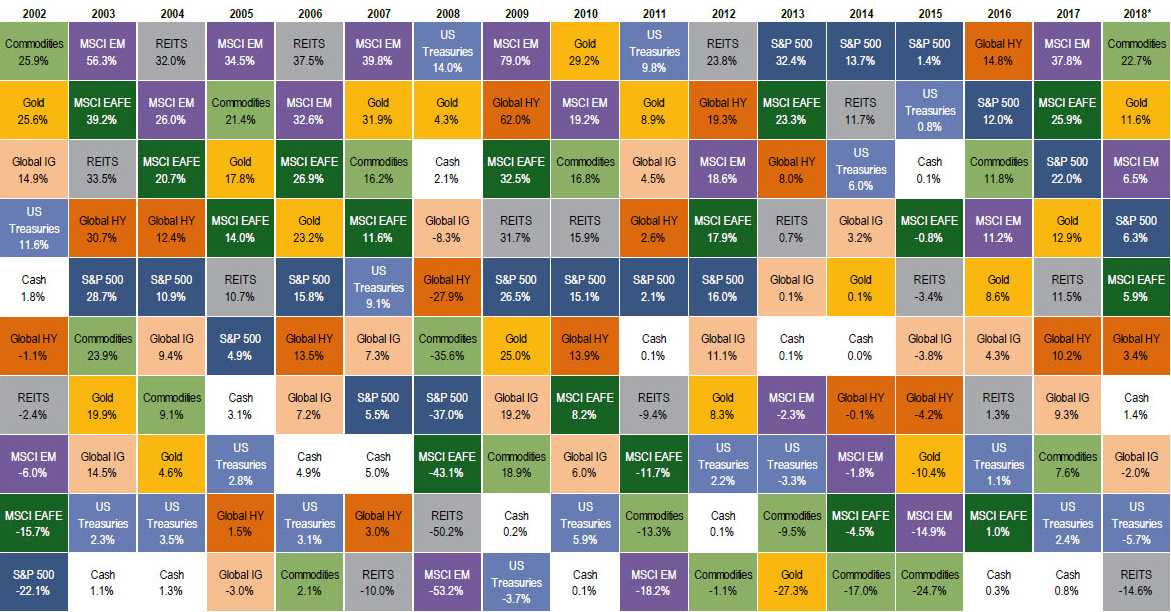
This table shows the fluctuating returns for various commodities over the past decade, from energy fuels to industrial and precious metals.
See all the 2.8 billion tonnes of metals mined in 2021.
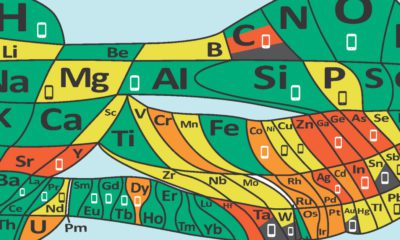
90 different elements form the building blocks for everything on Earth. Some are being used up, and soon could be endangered.
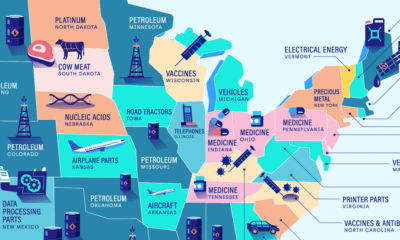
Petroleum is the top import in twelve states, making it the most commonly imported commodity across America. Here are America’s top imports.
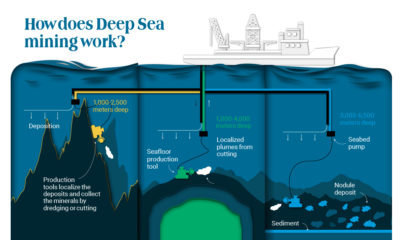
As more metals are necessary for electrification and clean energy transition, companies are looking at an unexplored market: ocean mining.
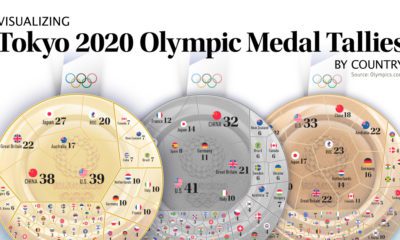
After 17 days and 339 events, the Tokyo Olympics have come to an end. Here we visualize the final medal tallies for every participating country.
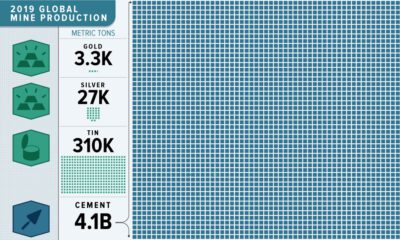
This massive infographic reveals the dramatic scale of 2019 non-fuel mineral global production.
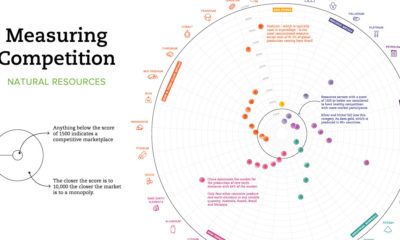
Which resource markets have healthy levels of competition, and which are more monopolistic? This chart shows the global level of competition for 33 minerals.
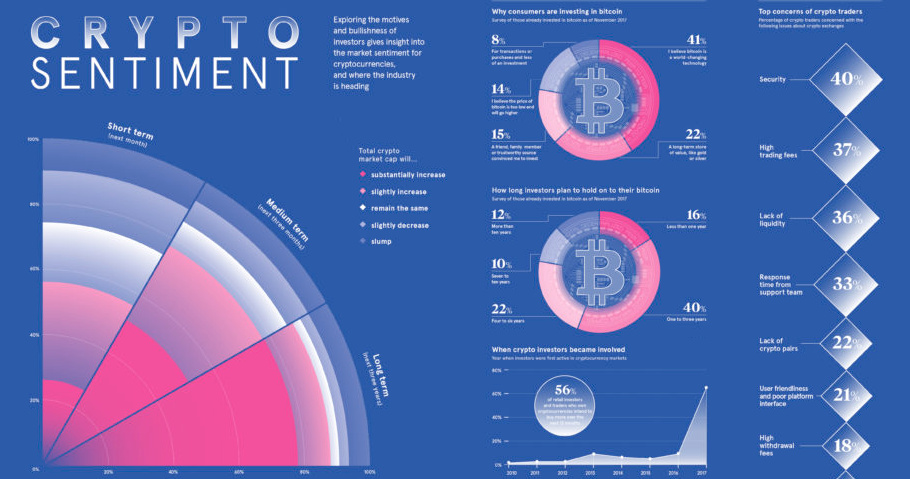
Breaking down the current sentiment for cryptocurrency, including future price expectations, reasons investors bought Bitcoin, and how long they'll hold.
Commodities have kicked off the year as the top performing asset class. Could the commodity supercycle be back from the dead?


 Creator Program