Technology
How Long Do Investors Plan to Hold Onto Bitcoin?
How Long Do Investors Plan to Hold Onto Bitcoin?
Did investors buy bitcoin because it was trendy, or are they committed to cryptocurrency for the long haul?
As in any new and rapidly-growing market, this kind of investor intent and the overall feeling of market sentiment matters a lot. That’s because there are no historical averages or ratios to apply as baselines for value, and if things head south there is always the possibility of a mass exodus.
Buy, Hodl, and Prosper?
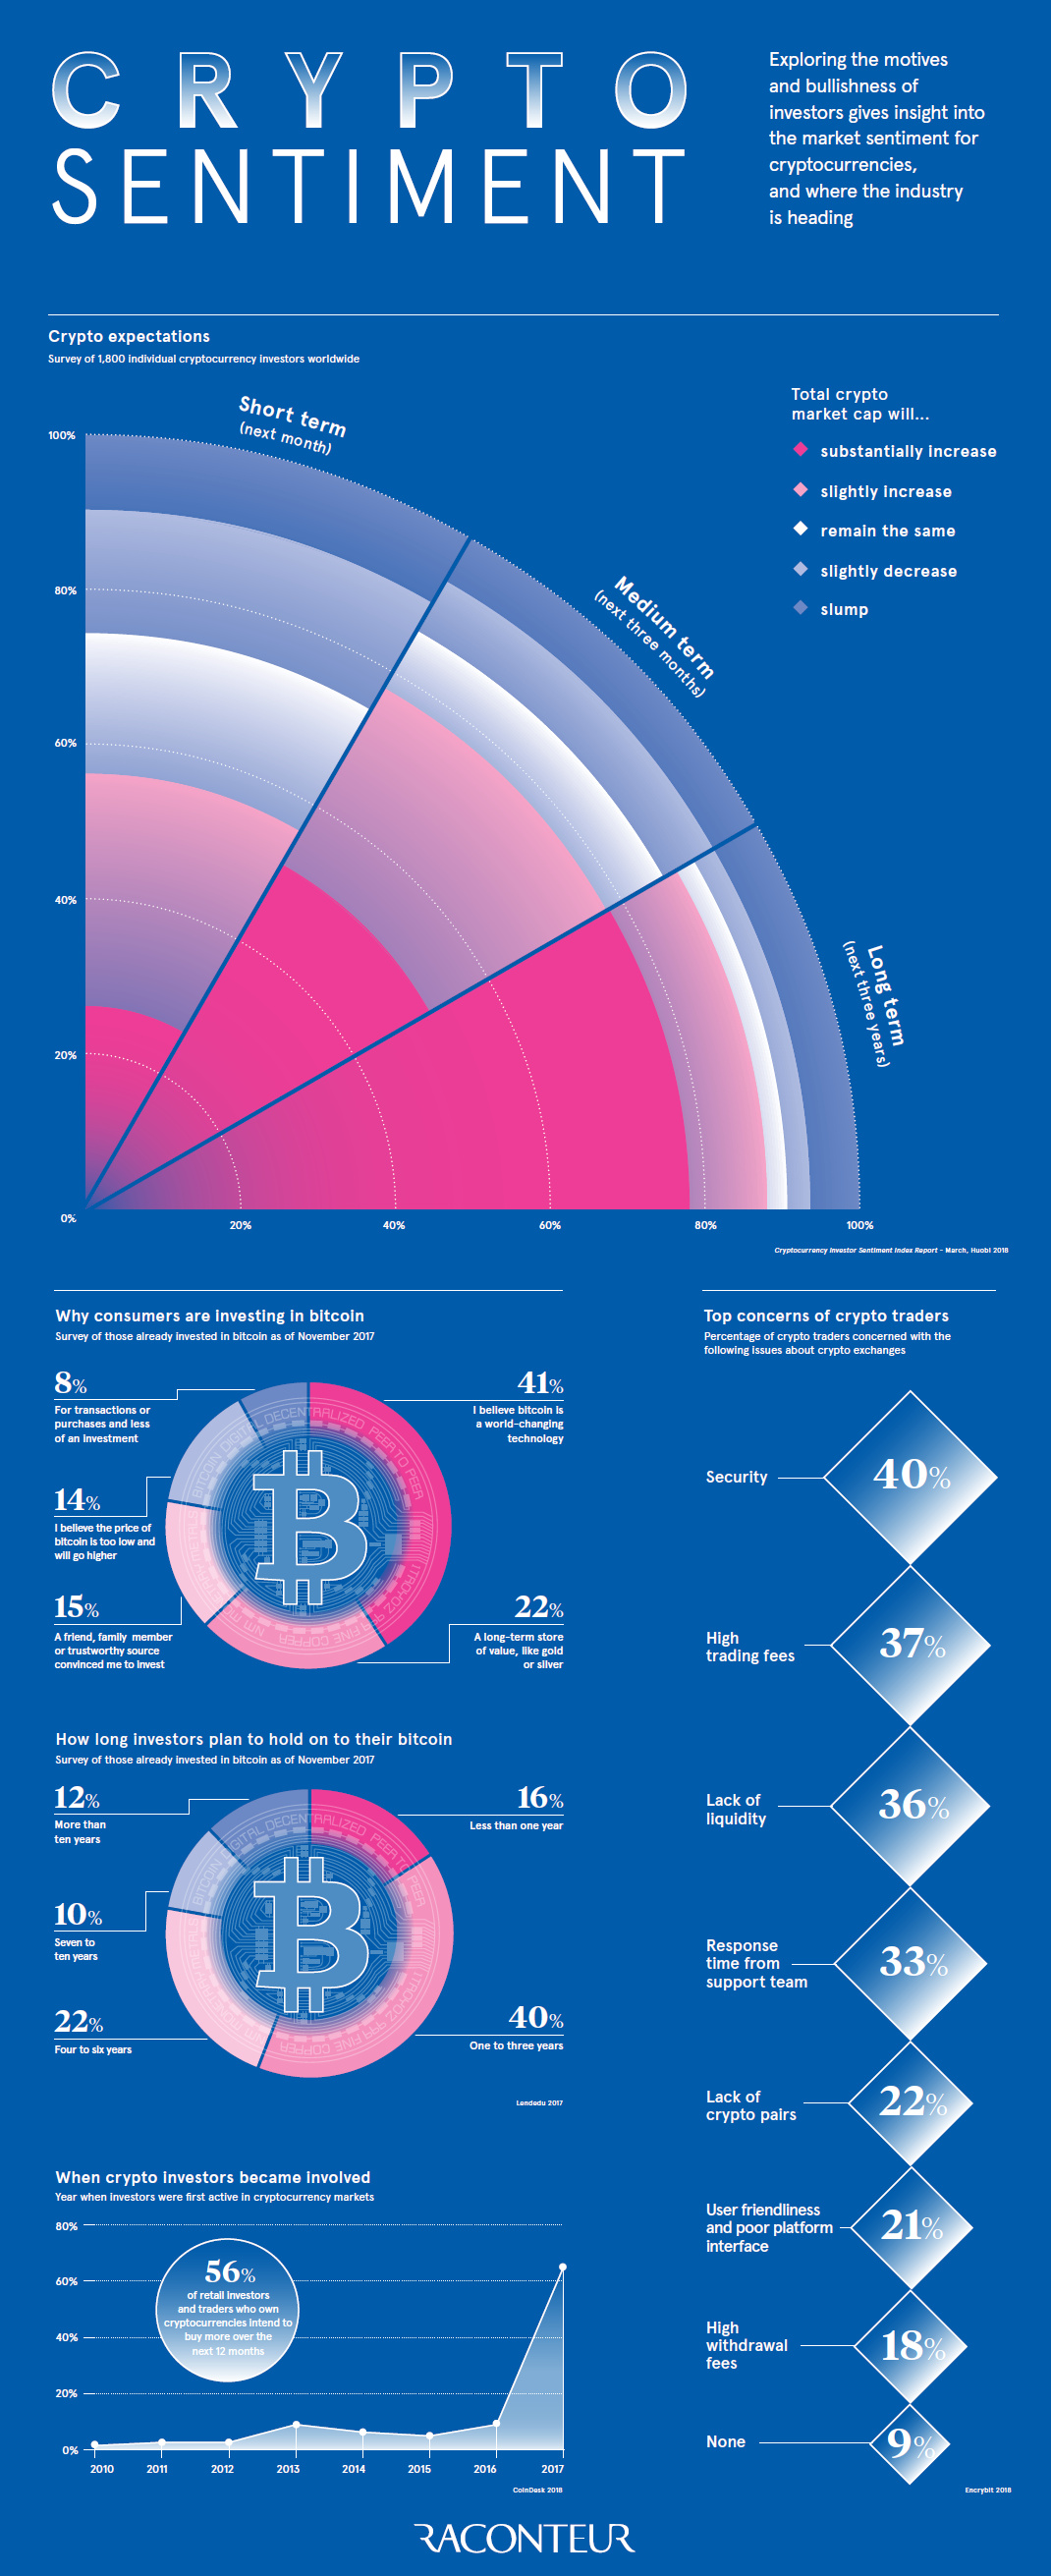
Today’s infographic comes to us from Raconteur, and it helps map out the future price expectations of crypto investors, along with how long they plan to hold onto their digital assets.
But before we get to that, let’s look at why investors bought into the market in the first place:
| Reasons for buying Bitcoin: | Share |
|---|---|
| I believe Bitcoin is a world-changing technology | 41% |
| A long-term store of value like gold or silver | 22% |
| A friend, family member, or trusted source convinced me | 15% |
| The price is low and will go higher | 14% |
| For transactions or purchases and less of an investment | 8% |
When did people get into the market?
More than 60% of investors got involved in cryptocurrency in 2017, and 56% of investors that hold crypto plan to buy more in the next 12 months.
Future Expectations
What do people expect crypto prices to do in the future, and how long are investors willing to hold?
According to a survey of 1,800 crypto investors around the world at the end of March 2018, a whopping 77.9% see the crypto market gaining more than 30% in value over the next three years.
Meanwhile, another poll from November 2017 asked investors how long they will hold onto their assets:
| How long will investors hold onto Bitcoin? | Share |
|---|---|
| >10 years | 12% |
| 7-10 years | 10% |
| 4-6 years | 22% |
| 1-3 years | 40% |
| <1 year | 16% |
Only 16% of respondents planned to sell within the next year, and 44% of respondents said they’d hold onto Bitcoin for four or more years.
Concerns About Exchanges
Exchanges are the lifeblood for buying or selling cryptocurrency – so what are the major concerns held by investors about them?
| Concerns about crypto exchanges | Share |
|---|---|
| Security | 40% |
| High trading fees | 37% |
| Lack of liquidity | 36% |
| Response time from support team | 33% |
| Lack of crypto pairs | 22% |
| User friendliness and poor platform interface | 21% |
| High withdrawal fees | 18% |
| None | 9% |
Security continues to be a topical issue for traders, which is not surprising since it’s estimated that $1.2 billion of crypto has been stolen since 2017. Other issues like high trading fees and the lack of liquidity and lack of currency pairs also poll high.


Technology
All of the Grants Given by the U.S. CHIPS Act
Intel, TSMC, and more have received billions in subsidies from the U.S. CHIPS Act in 2024.


All of the Grants Given by the U.S. CHIPS Act
This was originally posted on our Voronoi app. Download the app for free on iOS or Android and discover incredible data-driven charts from a variety of trusted sources.
This visualization shows which companies are receiving grants from the U.S. CHIPS Act, as of April 25, 2024. The CHIPS Act is a federal statute signed into law by President Joe Biden that authorizes $280 billion in new funding to boost domestic research and manufacturing of semiconductors.
The grant amounts visualized in this graphic are intended to accelerate the production of semiconductor fabrication plants (fabs) across the United States.
Data and Company Highlights
The figures we used to create this graphic were collected from a variety of public news sources. The Semiconductor Industry Association (SIA) also maintains a tracker for CHIPS Act recipients, though at the time of writing it does not have the latest details for Micron.
| Company | Federal Grant Amount | Anticipated Investment From Company |
|---|---|---|
| 🇺🇸 Intel | $8,500,000,000 | $100,000,000,000 |
| 🇹🇼 TSMC | $6,600,000,000 | $65,000,000,000 |
| 🇰🇷 Samsung | $6,400,000,000 | $45,000,000,000 |
| 🇺🇸 Micron | $6,100,000,000 | $50,000,000,000 |
| 🇺🇸 GlobalFoundries | $1,500,000,000 | $12,000,000,000 |
| 🇺🇸 Microchip | $162,000,000 | N/A |
| 🇬🇧 BAE Systems | $35,000,000 | N/A |
BAE Systems was not included in the graphic due to size limitations
Intel’s Massive Plans
Intel is receiving the largest share of the pie, with $8.5 billion in grants (plus an additional $11 billion in government loans). This grant accounts for 22% of the CHIPS Act’s total subsidies for chip production.
From Intel’s side, the company is expected to invest $100 billion to construct new fabs in Arizona and Ohio, while modernizing and/or expanding existing fabs in Oregon and New Mexico. Intel could also claim another $25 billion in credits through the U.S. Treasury Department’s Investment Tax Credit.
TSMC Expands its U.S. Presence
TSMC, the world’s largest semiconductor foundry company, is receiving a hefty $6.6 billion to construct a new chip plant with three fabs in Arizona. The Taiwanese chipmaker is expected to invest $65 billion into the project.
The plant’s first fab will be up and running in the first half of 2025, leveraging 4 nm (nanometer) technology. According to TrendForce, the other fabs will produce chips on more advanced 3 nm and 2 nm processes.
The Latest Grant Goes to Micron
Micron, the only U.S.-based manufacturer of memory chips, is set to receive $6.1 billion in grants to support its plans of investing $50 billion through 2030. This investment will be used to construct new fabs in Idaho and New York.

-

 Brands6 days ago
How Tech Logos Have Evolved Over Time
-

 Demographics2 weeks ago
The Smallest Gender Wage Gaps in OECD Countries
-

 Economy2 weeks ago
Where U.S. Inflation Hit the Hardest in March 2024
-

 Green2 weeks ago
Top Countries By Forest Growth Since 2001
-

 United States2 weeks ago
Ranked: The Largest U.S. Corporations by Number of Employees
-

 Maps2 weeks ago
The Largest Earthquakes in the New York Area (1970-2024)
-

 Green2 weeks ago
Ranked: The Countries With the Most Air Pollution in 2023
-

 Green2 weeks ago
Ranking the Top 15 Countries by Carbon Tax Revenue