Mapped: The 10 U.S. States With the Lowest Real GDP Growth
Ranked: The World’s 50 Largest Private Equity Firms
Top 10 Countries Most in Debt to the IMF
Ranked: The Top 6 Economies by Share of Global GDP (1980-2024)
Mapped: Europe’s GDP Per Capita, by Country
Countries With the Highest Rates of Crypto Ownership
Mapped: The Number of AI Startups By Country
All of the Grants Given by the U.S. CHIPS Act
Visualizing AI Patents by Country
How Tech Logos Have Evolved Over Time
Visualizing America’s Average Retirement Savings, by Age
Visualizing the Tax Burden of Every U.S. State
Charted: What Frustrates Americans About the Tax System
Ranked: The Top 20 Countries in Debt to China
Mapped: Countries Where Recreational Cannabis is Legal
Which Countries Have the Highest Infant Mortality Rates?
Life Expectancy by Region (1950-2050F)
What Causes Preventable Child Deaths?
The Cost of an EpiPen in Major Markets
Who’s Building the Most Solar Energy?
Mapped: The Age of Energy Projects in Interconnection Queues, by State
Ranked: The Top 10 EV Battery Manufacturers in 2023
The World’s Biggest Nuclear Energy Producers
The World’s Biggest Oil Producers in 2023
Mapped: The Top Exports in Asian Countries
Mapped: U.S. States By Number of Cities Over 250,000 Residents
Mapped: U.S. Immigrants by Region
The Biggest Salt Producing Countries in 2023
Visualizing Copper Production by Country in 2023
Where the World’s Aluminum is Smelted, by Country
Visualizing Global Gold Production in 2023
How People Get Around in America, Europe, and Asia
The Carbon Footprint of Major Travel Methods
Ranking the Top 15 Countries by Carbon Tax Revenue
Ranked: The Countries With the Most Air Pollution in 2023
Top Countries By Forest Growth Since 2001
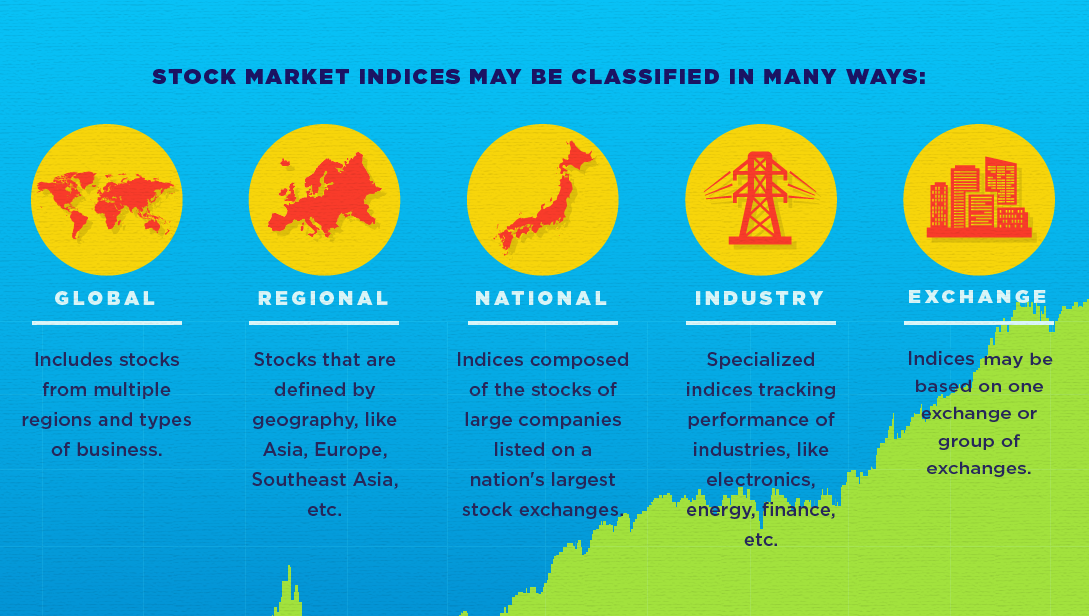
This infographic helps to explain the basics around what a stock market index is, and what it does.
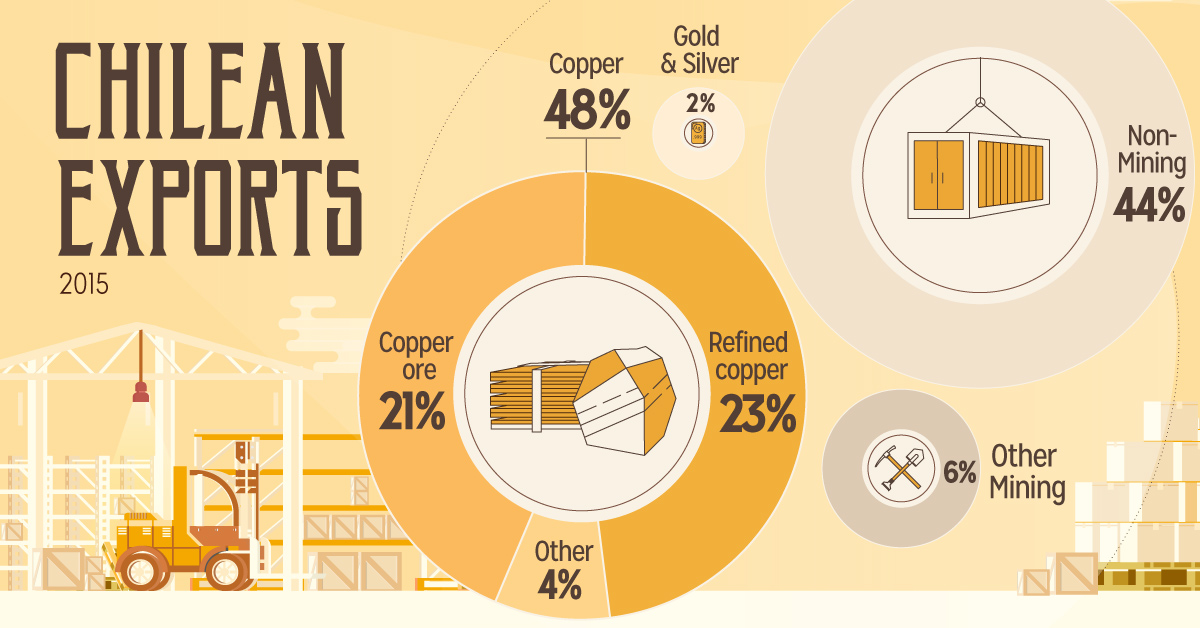
How Chile became a copper powerhouse, and how this helped to propel its economy to become the richest and freest in Latin America.
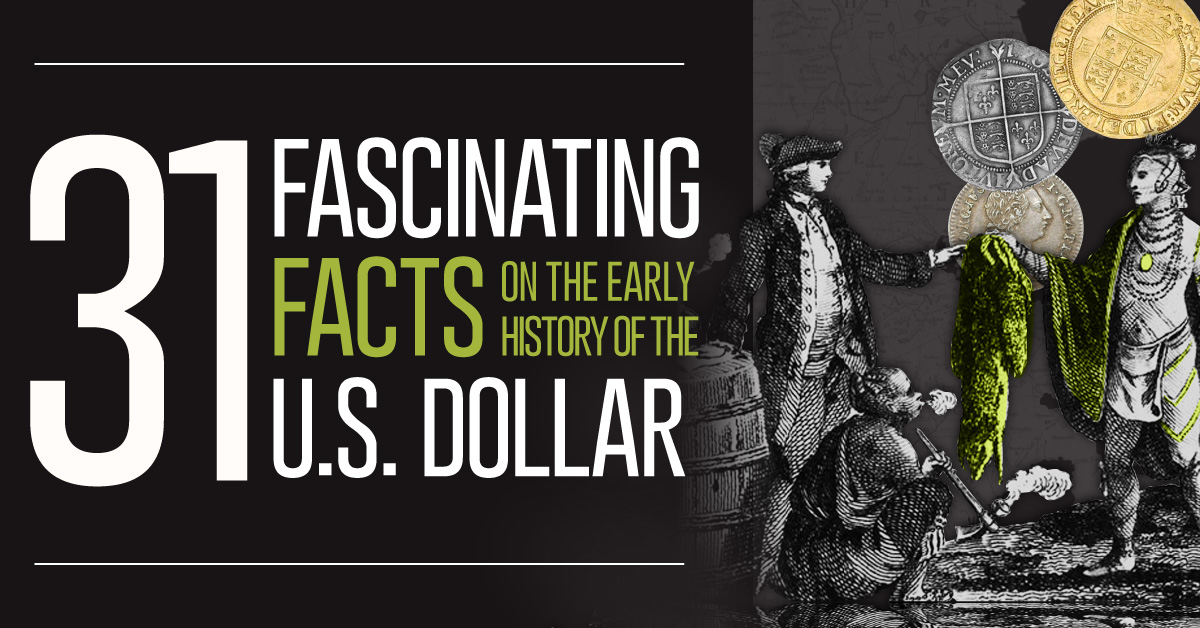
Today, the U.S. dollar is an iconic currency familiar to all. But do you know the history of U.S. currency, and events that shaped the dollar...
Building wealth is not about tricks or 'get rich quick' schemes. This infographic shows the habits of millionaires that create success over the long-term.
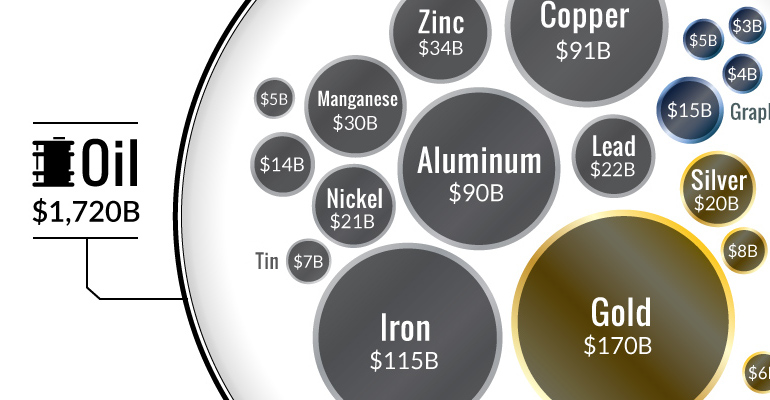
Ever wonder why the oil industry has so much influence? This chart shows that all metal markets combined don't even come close to touching the oil...
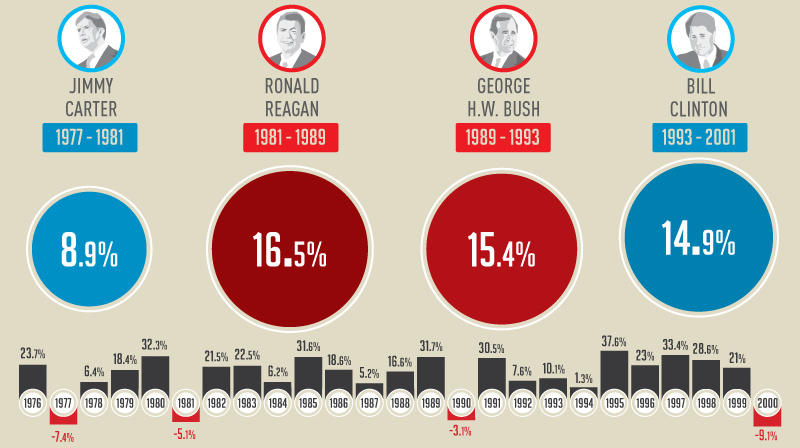
This infographic shows how the U.S. market performs in each year of a presidential term - and specifically, how the market does in election years.
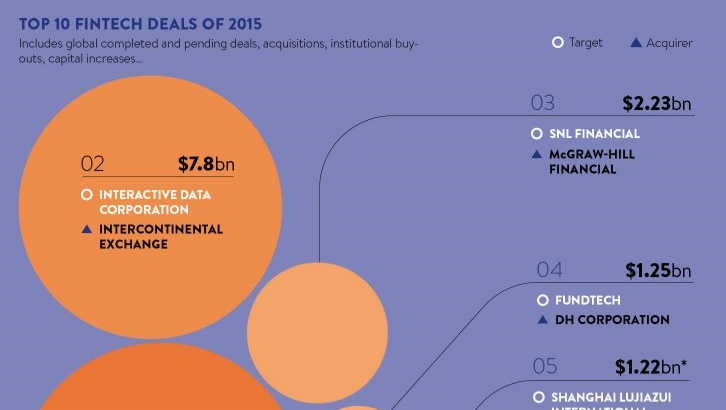
The fintech sector has been on fire lately. In today's infographic, we look back on the sector in 2015 to review the 10 biggest fintech deals...
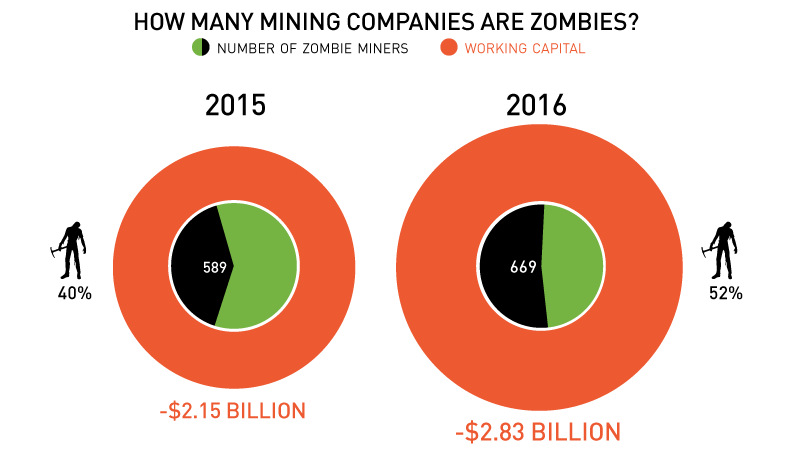
Mind-blowing fact: 52% of Canadian-listed mining companies are now considered "zombies", or companies with negative working capital.
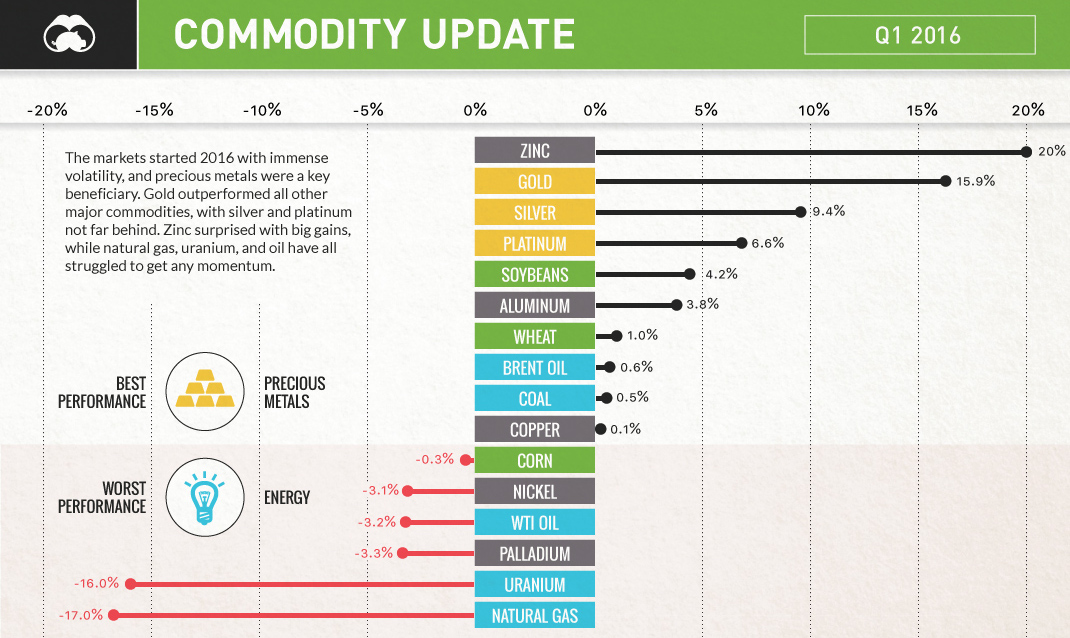
How did commodities do in Q1 of 2016? It's a mixed bag - precious metals rocketed amid market volatility, while natural gas and uranium got pounded.
The first Oscar was given out at the 1929 Academy Awards, but the statuette has undergone changes in construction ever since. Here's how an Oscar is...