Mapped: The 10 U.S. States With the Lowest Real GDP Growth
Ranked: The World’s 50 Largest Private Equity Firms
Top 10 Countries Most in Debt to the IMF
Ranked: The Top 6 Economies by Share of Global GDP (1980-2024)
Mapped: Europe’s GDP Per Capita, by Country
Countries With the Highest Rates of Crypto Ownership
Mapped: The Number of AI Startups By Country
All of the Grants Given by the U.S. CHIPS Act
Visualizing AI Patents by Country
How Tech Logos Have Evolved Over Time
Visualizing America’s Average Retirement Savings, by Age
Visualizing the Tax Burden of Every U.S. State
Charted: What Frustrates Americans About the Tax System
Ranked: The Top 20 Countries in Debt to China
Mapped: Countries Where Recreational Cannabis is Legal
Which Countries Have the Highest Infant Mortality Rates?
Life Expectancy by Region (1950-2050F)
What Causes Preventable Child Deaths?
The Cost of an EpiPen in Major Markets
Who’s Building the Most Solar Energy?
Mapped: The Age of Energy Projects in Interconnection Queues, by State
Ranked: The Top 10 EV Battery Manufacturers in 2023
The World’s Biggest Nuclear Energy Producers
The World’s Biggest Oil Producers in 2023
Mapped: The Top Exports in Asian Countries
Mapped: U.S. States By Number of Cities Over 250,000 Residents
Mapped: U.S. Immigrants by Region
The Biggest Salt Producing Countries in 2023
Visualizing Copper Production by Country in 2023
Where the World’s Aluminum is Smelted, by Country
Visualizing Global Gold Production in 2023
How People Get Around in America, Europe, and Asia
The Carbon Footprint of Major Travel Methods
Ranking the Top 15 Countries by Carbon Tax Revenue
Ranked: The Countries With the Most Air Pollution in 2023
Top Countries By Forest Growth Since 2001
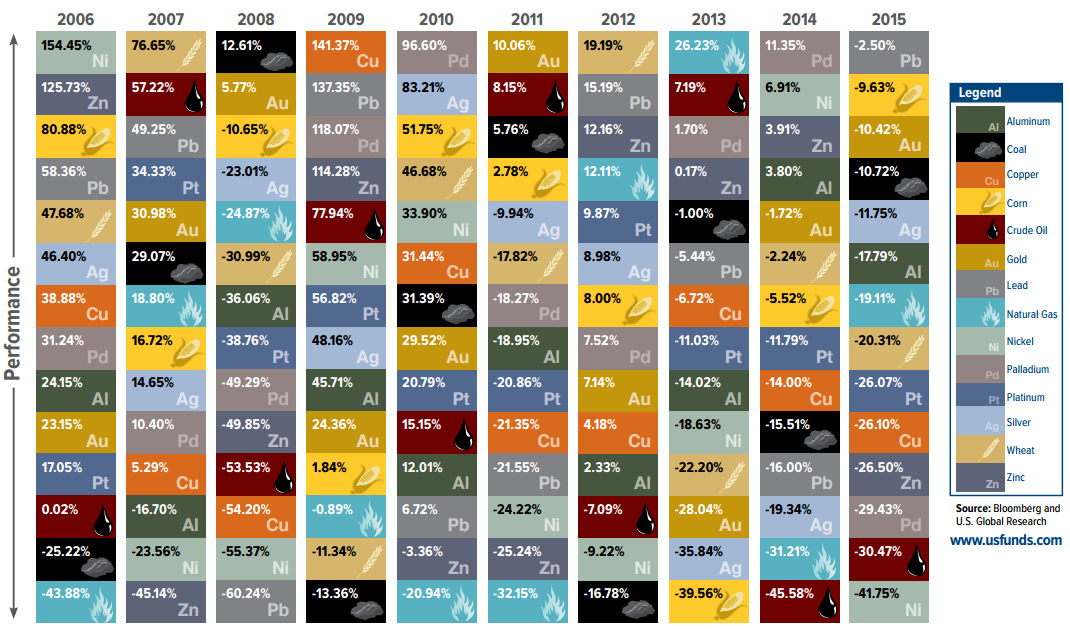
How investments in commodities have fared over the last decade, summarized in "The Periodic Table of Commodity Returns".
What are the world's most valuable substances? This infographic looks at everything ranging from Iranian beluga caviar to rare metals and gemstones to find out.
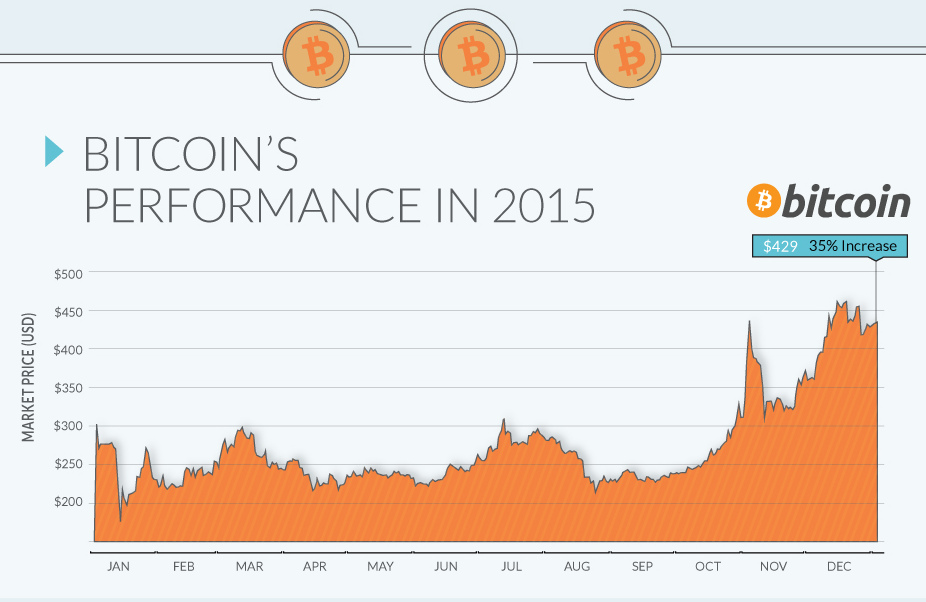
In a year that the US dollar gained on most currencies, it was the digital cryptocurrency Bitcoin that was the top performer by a significant margin.
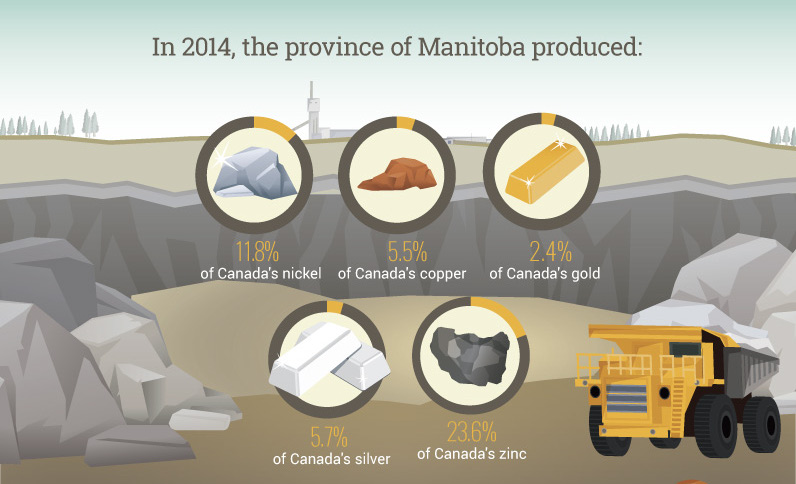
See how mining contributes to the wealth of people in the province of Manitoba as well as the rest of Canada.
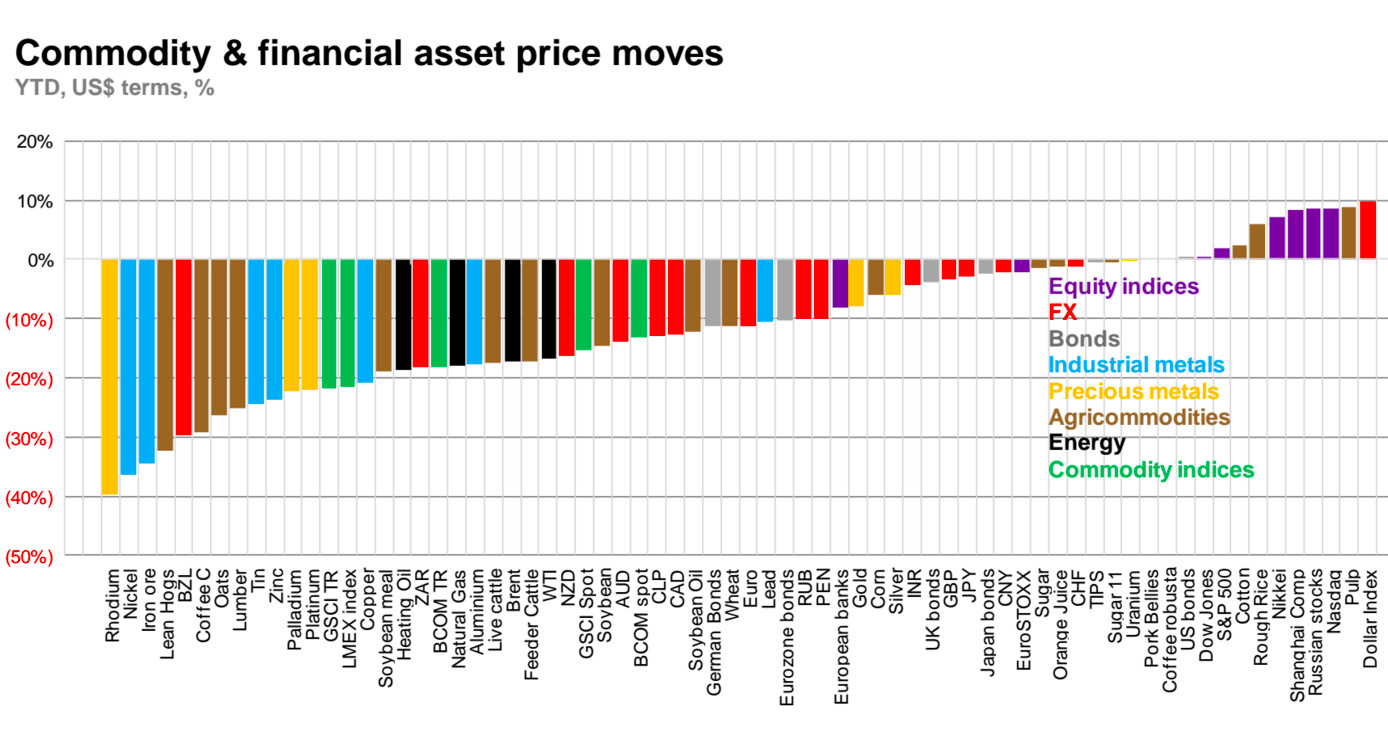
Today's chart from Macquarie shows all asset classes YTD, and gives perspective on the 2015 collapse of commodities.
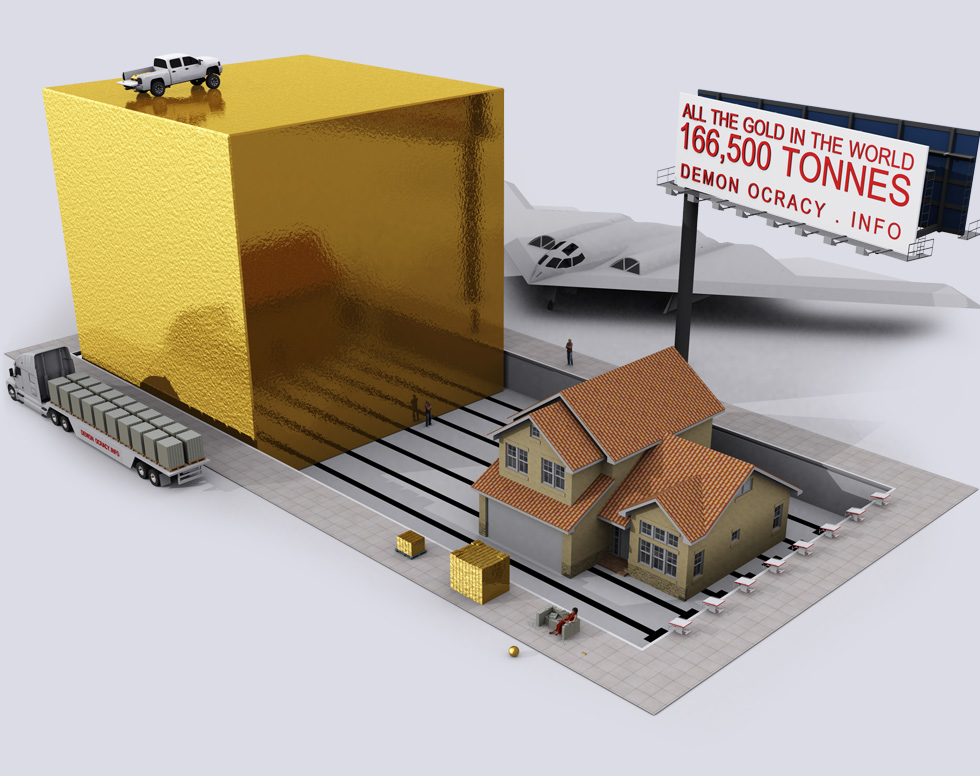
How rare is gold? This set of 3D visualizations show the world's gold in bullion bars.
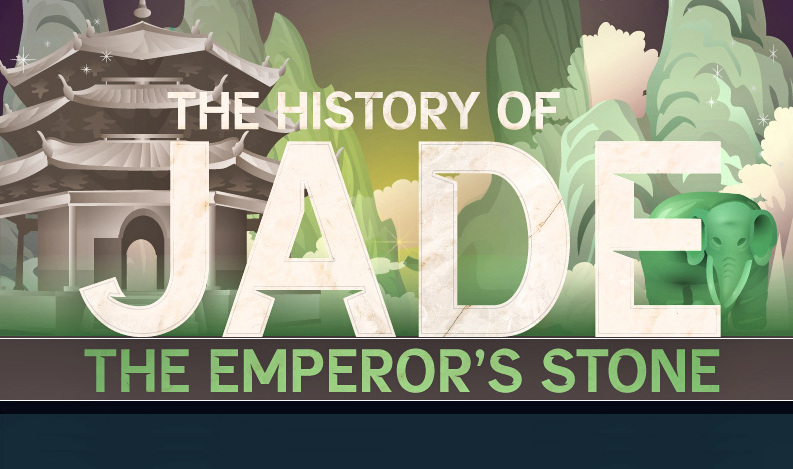
Jade has been revered in China for thousands of years. See the history of this gemstone and why people are willing to pay high prices for...
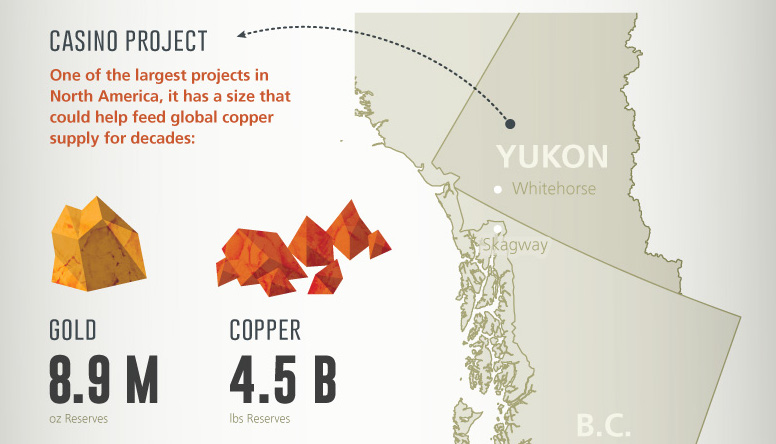
This company snapshot infographic highlights Western Copper and Gold, a company developing Canada's premiere copper and gold mine.
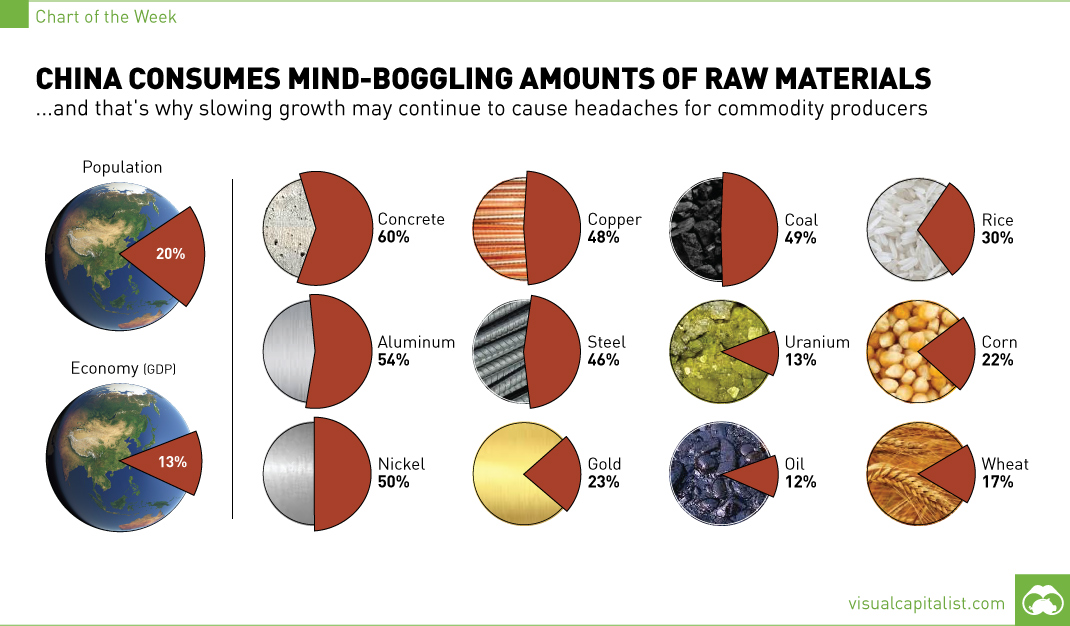
The 1.4 billion people living in China account for 13% of global GDP, but this chart shows that for commodity producers, the country means so much...
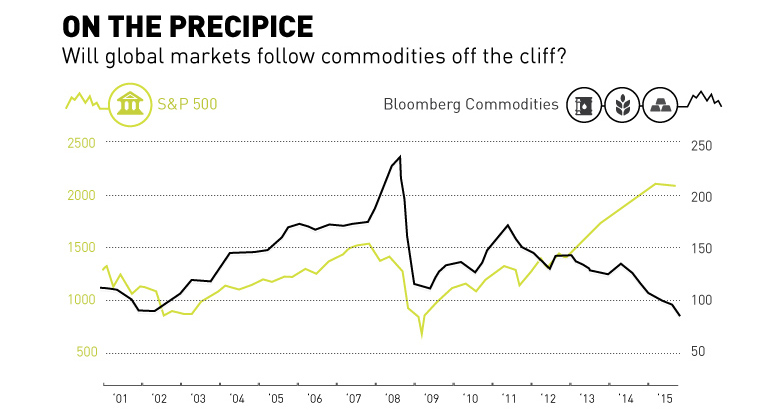
Commodities have fell off the cliff with oil and base metals getting crushed over the last year. Is the general market about to follow the same...