Mining
How Copper Riches Helped Shape Chile’s Economic Story
Although Chile has always been noted for its abundant mineral wealth, the country was actually not a notable copper producer even at the beginning of the 20th century.
In 1907, for example, the United States was able to produce nearly 14X as much copper as Chile. The reality was that shortages in capital, organization, and water kept the country’s massive, low-grade deposits from being developed at any significant scale.
The Copper Standard
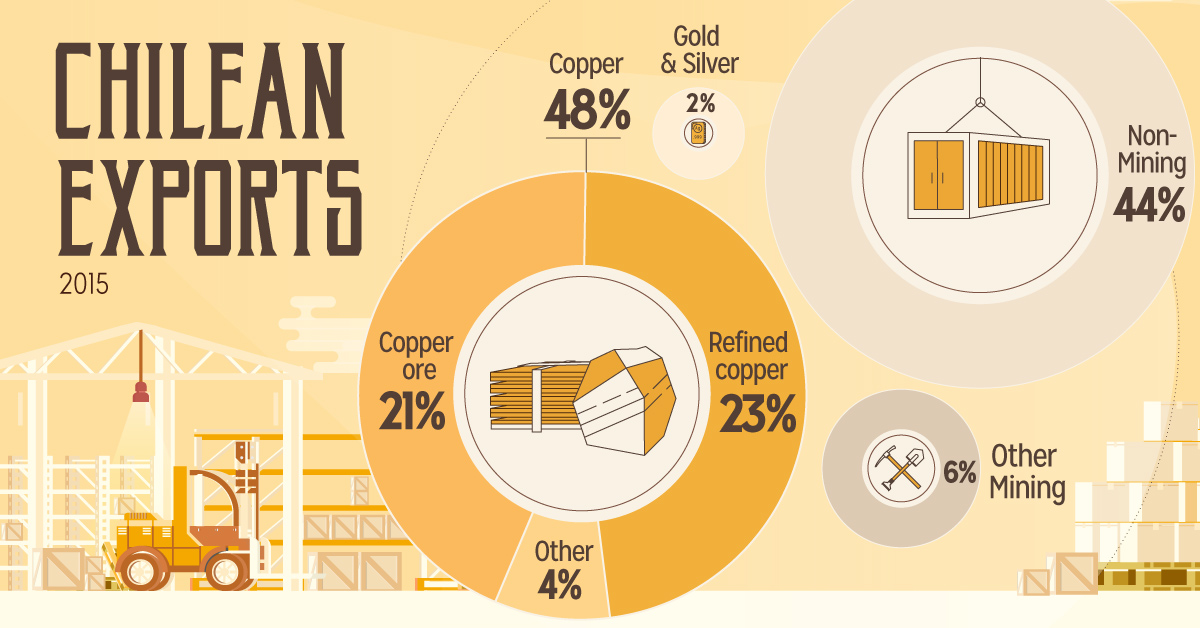
Things would change dramatically for Chile. The country has been the world’s top copper producer now for over 30 years, and today close to 50% of the country’s exports come from copper-related products.
Today’s infographic comes from Altiplano Minerals and it tells the story of how Chile tapped into its copper wealth to become the richest and freest economy in Latin America.

New milling technology, economic reforms, and increasing investment attractiveness were catalysts that turned Chile into a copper powerhouse. In turn, copper exports helped propel the Chilean economy to new heights.
“The Miracle of Chile”
This incredible leap can be summed up aptly with two facts:
1) Copper production went from under 1 million tonnes per year (late-1970s) to over 5 million tonnes per year (2000s).
2) Despite this massive rise, copper as a percent of exports fell. It went from a peak of 80% of exports to closer to 50% today.
Over this time, as the economy diversified, Chilean GDP per capita (PPP) gained massive ground on the Latin American average and passed it in the early 1990s.
Chile’s GDP per capita (PPP) today is the highest in Latin America of major economies:
| GDP per capita (2015, PPP) | |
|---|---|
| Chile | $24,170 |
| Argentina | $22,459 |
| Mexico | $18,370 |
| Venezuela | $17,430 |
| Brazil | $15,941 |
| Colombia | $14,164 |
| Peru | $12,639 |
| Ecuador | $11,839 |
| Guatemala | $7,704 |
That said, critics of Chile’s economy will point to its inequality. The country’s Gini Coefficient, according to the World Bank, is higher (less equal) than only a handful of Latin American & Caribbean economies: Panama, Belize, Haiti, Suriname, Honduras, and Colombia.
Mining in Chile Today
Today, Chile’s mines produce copper, gold, molybdenum, iron, and silver. The country also produces more lithium than any country from its salars.
The country is the world’s undisputed copper heavyweight champion – it’s been the top producer for 30+ years and holds an impressive seven of the world’s top 14 copper mines. The biggest mine, Escondida, produces over a million tonnes of the red metal each year, equal to 5% of the world’s annual copper supply.
The copper crown is likely to be held by Chile in the future, as well. According to Cochilco, between 2000-2015 about 35 copper deposits and three gold deposits were discovered in central-north Chile. They increased the country’s resources by 208.6 million tons of copper and 34.3 million oz of gold.
The new copper discovered is roughly equal to 30% of global discoveries over the same time period.


Lithium
Ranked: The Top 10 EV Battery Manufacturers in 2023
Asia dominates this ranking of the world’s largest EV battery manufacturers in 2023.


The Top 10 EV Battery Manufacturers in 2023
This was originally posted on our Voronoi app. Download the app for free on iOS or Android and discover incredible data-driven charts from a variety of trusted sources.
Despite efforts from the U.S. and EU to secure local domestic supply, all major EV battery manufacturers remain based in Asia.
In this graphic we rank the top 10 EV battery manufacturers by total battery deployment (measured in megawatt-hours) in 2023. The data is from EV Volumes.
Chinese Dominance
Contemporary Amperex Technology Co. Limited (CATL) has swiftly risen in less than a decade to claim the title of the largest global battery group.
The Chinese company now has a 34% share of the market and supplies batteries to a range of made-in-China vehicles, including the Tesla Model Y, SAIC’s MG4/Mulan, and various Li Auto models.
| Company | Country | 2023 Production (megawatt-hour) | Share of Total Production |
|---|---|---|---|
| CATL | 🇨🇳 China | 242,700 | 34% |
| BYD | 🇨🇳 China | 115,917 | 16% |
| LG Energy Solution | 🇰🇷 Korea | 108,487 | 15% |
| Panasonic | 🇯🇵 Japan | 56,560 | 8% |
| SK On | 🇰🇷 Korea | 40,711 | 6% |
| Samsung SDI | 🇰🇷 Korea | 35,703 | 5% |
| CALB | 🇨🇳 China | 23,493 | 3% |
| Farasis Energy | 🇨🇳 China | 16,527 | 2% |
| Envision AESC | 🇨🇳 China | 8,342 | 1% |
| Sunwoda | 🇨🇳 China | 6,979 | 1% |
| Other | - | 56,040 | 8% |
In 2023, BYD surpassed LG Energy Solution to claim second place. This was driven by demand from its own models and growth in third-party deals, including providing batteries for the made-in-Germany Tesla Model Y, Toyota bZ3, Changan UNI-V, Venucia V-Online, as well as several Haval and FAW models.
The top three battery makers (CATL, BYD, LG) collectively account for two-thirds (66%) of total battery deployment.
Once a leader in the EV battery business, Panasonic now holds the fourth position with an 8% market share, down from 9% last year. With its main client, Tesla, now sourcing batteries from multiple suppliers, the Japanese battery maker seems to be losing its competitive edge in the industry.
Overall, the global EV battery market size is projected to grow from $49 billion in 2022 to $98 billion by 2029, according to Fortune Business Insights.

-

 Mining1 week ago
Gold vs. S&P 500: Which Has Grown More Over Five Years?
-

 Markets2 weeks ago
Ranked: The Most Valuable Housing Markets in America
-

 Money2 weeks ago
Which States Have the Highest Minimum Wage in America?
-

 AI2 weeks ago
Ranked: Semiconductor Companies by Industry Revenue Share
-

 Markets2 weeks ago
Ranked: The World’s Top Flight Routes, by Revenue
-

 Countries2 weeks ago
Population Projections: The World’s 6 Largest Countries in 2075
-

 Markets2 weeks ago
The Top 10 States by Real GDP Growth in 2023
-

 Demographics2 weeks ago
The Smallest Gender Wage Gaps in OECD Countries