Sponsored
Deep Diving for Metals: Visualizing Ocean Mining
The following content is sponsored by Prospector
Deep Diving for Metals: Visualizing Ocean Mining
The mining sector has been one of the biggest beneficiaries in the COVID-19 recovery.
Several countries’ recovery packages have ignited demand for commodities like copper, iron ore and lithium. Given that more metals are necessary for electrification and the clean energy transition, many companies are looking at an unexplored market: ocean mining.
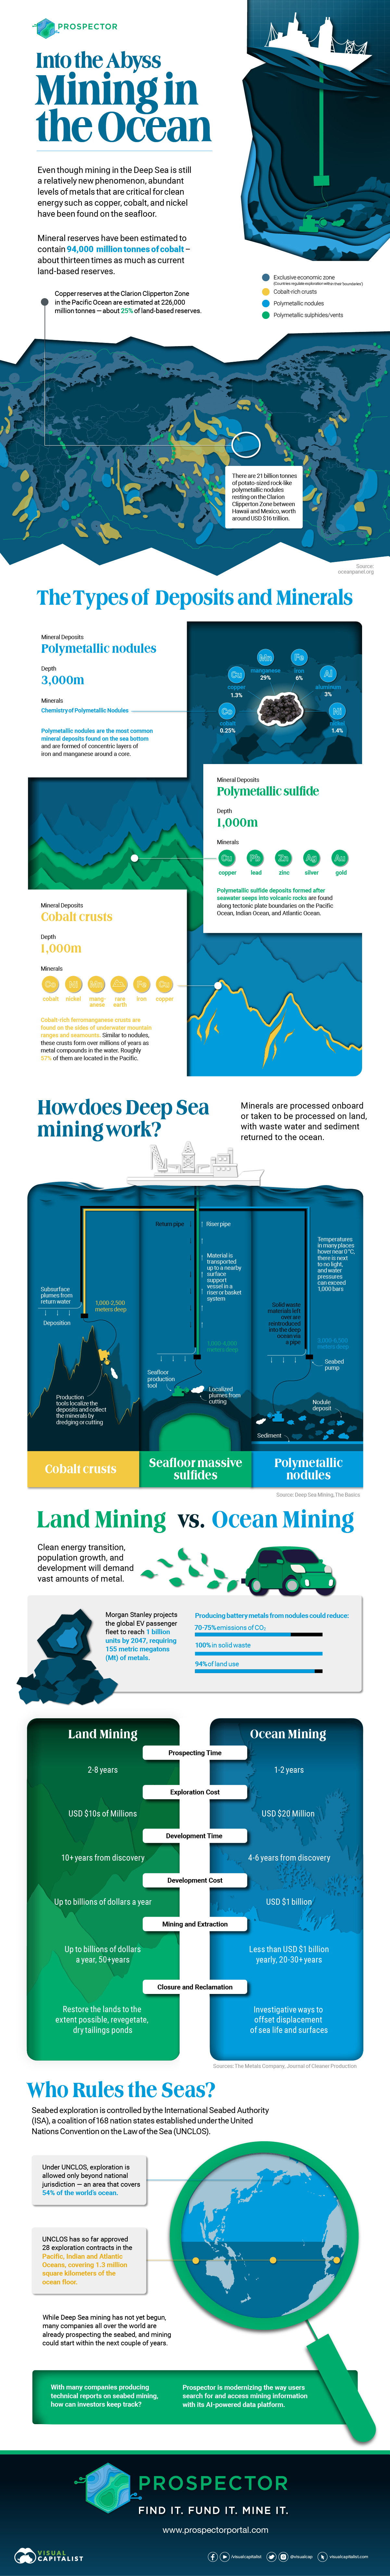
Mining of the Deep Sea is still under study but metals are abundant on the seafloor. Reserves are estimated to be worth anywhere from $8 trillion to more than $16 trillion.
This infographic from Prospector provides a visual overview of the seabed mining process.
Down in the Depths
The most prolific area for ocean mining is the Clarion Clipperton Zone (CCZ) in the Eastern Pacific Ocean, between Hawaii and Mexico. Almost 20 international mining companies have contracts to explore the region which spans over 5,000 kilometers.
Most of the metals are found in potato-sized rock-like polymetallic nodules. Millions of years old, the nodules grow by absorbing metals from the seawater, expanding slowly around the core of shell, bone, or rock.
Mineral Deposits | Depth | Minerals |
---|---|---|
Polymetallic sulfide | 1,000 to 4,000m | Copper, lead, zinc, silver, and gold |
Polymetallic nodules | 3,000 to 6,500m | Nickel, cobalt, manganese, copper, ammonium sulfate |
Cobalt crusts | 1,000 to 2,500m | Cobalt, nickel, manganese, rare earth, iron, copper |
Source: The Pew Charitable Trusts
It is estimated that there are 21 billion tonnes of polymetallic nodules resting on the ocean floor in the CCZ, containing an estimated:
- 6 billion tonnes of manganese
- 226 million tonnes of copper – about 25% of land-based reserves
- 94,000 million tonnes of cobalt – about six times as much as current land-based reserves
- 270 million tonnes of nickel – 100 times the annual global nickel production in 2019
Cobalt-rich ferromanganese crusts are found on the sides of underwater mountain ranges and seamounts. Similar to nodules, these crusts form over millions of years as metal compounds in the water. Roughly 57% of them are located in the Pacific.
Polymetallic sulfide deposits formed after seawater seeps into volcanic rocks can be found along tectonic plate boundaries on the Pacific Ocean, Indian Ocean, and the Atlantic Ocean.
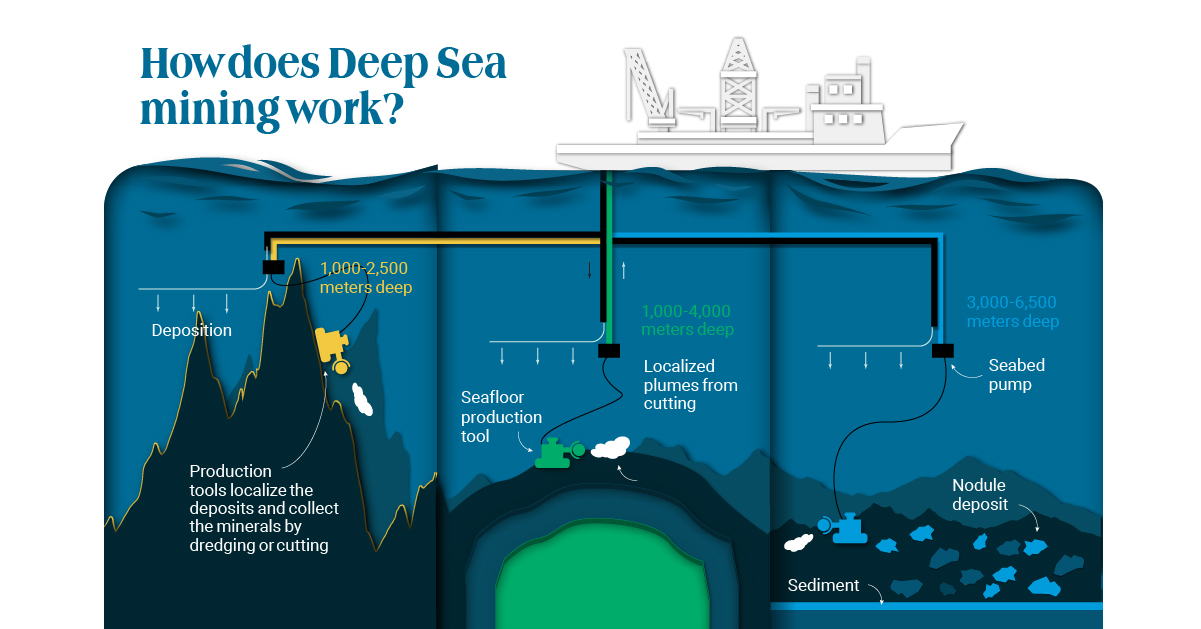
How Does Ocean Mining Work?
Extraction of minerals from the seafloor is planned to involve either modified dredging (for nodules), cutting (for massive sulphides and crusts), and transport of the material as a slurry in a riser or basket system to a surface support vessel.
The mineral-bearing material is then processed in a ship (cleaning and dewatering – with the wastewater and sediment being returned to the ocean) and then transferred to a barge for transport to shore where it will be further processed to extract the target metals.
Towards a Greener Future
Growing demand for batteries to power electric cars and store wind and solar energy has driven up the cost of many metals and bolstered the business case for seabed mining.
According to a study published in the Journal of Cleaner Production, producing battery metals from nodules could reduce emissions of CO² by 70-75%, cut land use by 94% and eliminate 100% of solid waste.
Here is a look at how ocean and land mining compares:
Process | Ocean Mining | Land Mining |
---|---|---|
Prospecting time | 1-2 years | 2-8 years |
Exploration cost | USD $20 million | USD $10 million |
Development time | 4-6 years from discovery | 10+ years from discovery |
Development cost | USD $1 billion | Up to billions of dollars a year |
Mining and extraction | Less than USD $1 billion yearly, 20-30+ years | Up to billions of dollars a year, 50+ years |
Closure and reclamation | Investigative ways to offset displacement of sea life and surfaces | Restore the lands to the extent possible, revegetate, dry tailings ponds |
Source: The Metals Company
The United Nations Convention on the Law of the Sea (UNCLOS) has so far approved 28 exploration contracts in the Pacific, Indian and Atlantic Oceans, covering 1.3 million square kilometers of the ocean floor.
With many companies turning their eyes to the unexplored riches of the ocean, seabed mining could offer a wealth of untapped minerals on the ocean floor.
Support the Future of Data Storytelling
Sorry to interrupt your reading, but we have a favor to ask. At Visual Capitalist we believe in a world where data can be understood by everyone. That’s why we want to build the VC App - the first app of its kind combining verifiable and transparent data with beautiful, memorable visuals. All available for free.
As a small, independent media company we don’t have the expertise in-house or the funds to build an app like this. So we’re asking our community to help us raise funds on Kickstarter.
If you believe in data-driven storytelling, join the movement and back us on Kickstarter!
Thank you.

Sponsored
Visualizing Raw Material Inflation in Canada
Over the last year, raw material inflation in Canada was 37%. Which material prices jumped the most, and how does this impact manufacturers?

Raw Material Inflation in Canada
Inflation in Canada is climbing, and it has impacted the raw materials manufacturers use to produce goods. In fact, raw material prices have climbed 37% year-over-year on average.
More than half of manufacturers say this is one of their top challenges. In this graphic from Canadian Manufacturers & Exporters (CME), we show which materials have seen the biggest price spikes over the last year.
Inflation by Raw Material
The table below shows the rate of inflation in Canada for select raw materials from May 2021 to May 2022.
Raw Material | Category | Price Change (May 2021-May 2022) |
---|---|---|
Coal | Crude Energy | 95.2% |
Crude Oil & Bitumen | Crude Energy | 85.0% |
Wheat | Crops | 73.4% |
Natural Gas | Crude Energy | 50.3% |
Beans, Peas, & Lentils | Crops | 43.3% |
Logs & Forestry Products | Forestry Products & Natural Rubber | 42.1% |
Scrap Metal | Metal Ores & Scrap | 40.3% |
Canola/Rapeseed | Crops | 30.6% |
Potash | Non-metallic Minerals | 24.7% |
Fish & Fishery Products | Animal Products | 23.7% |
Lead & Zinc Ores | Metal Ores & Scrap | 21.2% |
Cattle & Calves | Animal Products | 10.2% |
Eggs in Shell | Animal Products | 8.4% |
Poultry | Animal Products | 8.3% |
Sand, Gravel, & Clay | Non-metallic Minerals | 8.1% |
Fresh Fruit & Nuts | Crops | 8.0% |
Nickel Ores | Metal Ores & Scrap | 5.8% |
Tin, Iron Alloys, & Other Ores | Metal Ores & Scrap | 3.3% |
Gold Ores | Metal Ores & Scrap | 2.1% |
Natural Rubber | Forestry Products & Natural Rubber | 1.4% |
Crude energy materials led the rise, with the price of coal nearly doubling over the last year. Oil and natural gas prices also rose amid war-related supply constraints and higher demand as people got back to pre-pandemic activities. This has far-reaching consequences for manufacturers given that oil and gas is widely used for transportation and heat, and is an input in thousands of products.
Wheat inflation in Canada reached 73.4%. The cost increase was partly due to a drought in Western Canada that reduced Canadian wheat production by nearly 40% from 2020 to 2021. Internationally, the Russia-Ukraine conflict also threatened wheat supply as the two countries normally account for almost a third of global wheat exports. Wheat inflation has affected food and fuel manufacturers the most, as it is used for livestock feed, biofuels, and a wide range of human food.
Simultaneously, the price of lumber increased by 42.1% because of an increased demand for housing, and flooding in British Columbia that reduced supply. This affects manufacturers who produce things like timber and plywood, and ultimately influences the cost of housing.
How Inflation in Canada Affects Manufacturers
Raw material inflation drives up manufacturers’ cost of doing business. Unfortunately, it isn’t the only price pressure they face. Ocean shipping costs are more than five times higher compared to when the pandemic began. Truck transportation costs rose by 15% from March 2021 to March 2022, based on the latest available data.
On top of this, manufacturers have to contend with supply chain disruptions, global uncertainty, and labor shortages. What can manufacturers do? A majority of manufacturers have been raising prices to pass on some of the additional costs to consumers.
Response to Supply Chain Challenges | % of Manufacturers |
---|---|
Increase prices | 80% |
Delay fulfilling customer orders | 79% |
Find alternative supplier of raw materials and other inputs | 69% |
Increase inventories | 63% |
Cut production | 30% |
Lay off workers | 9% |
Other | 7% |
Over the longer term, manufacturers say they plan to build stronger relationships with customers and suppliers, source critical raw materials from two suppliers, and bring their supplier base and production closer to home.
Looking ahead, most manufacturers say they expect supply chain issues to be resolved some time in 2023—though they were last asked this question before the war in Ukraine began. The Bank of Canada also expects inflation in Canada to ease in the second half of 2023. In the meantime, manufacturers will be forced to adapt to rising costs.
Learn more about how CME helps manufacturers grow at home and abroad through programs, services, and advocacy.
Sponsored
Operational Health Tech: A New Billion Dollar Market
Operational health tech is poised to be a multi-billion dollar industry. This graphic breaks down how its disrupting healthcare as we know it.

Operational Health Tech: A New Billion Dollar Market
Many lessons were learned throughout the COVID-19 pandemic, but what has become most apparent is the need to invest in healthcare on all fronts. In fact in just a few short years, businesses, governments, and consumers have had to entirely reassess healthcare in ways not quite seen before.
What’s more, this elevated importance placed on health could be here to stay, and one area in particular is poised for significant growth: operational health tech.
The graphic above from our sponsor Bloom Health Partners dives into the burgeoning market that is operational health tech, and reveals the key driving forces behind it.
What is Operational Health?
To start, operational health is an industry that provides health services to employees to help keep companies running smoothly.
A critical piece of operational health is workplace health, which is expected to soar in value. From 2021 to 2025, the market for workplace health is expected to grow 200% from $6.5 billion to $19.5 billion.
The industry is undergoing a tremendous amount of innovation, specifically in relation to technological advances.
Operational Health Tech: Disrupting Healthcare
The operational health tech industry is disrupting traditional healthcare by providing direct services to employees in the workplace.
For decades now, the U.S. has increasingly become a statistical outlier for healthcare spending relative to health outcomes. For instance, the average American incurs $9,000 in healthcare spending per year, nearly twice that of OECD countries, yet life expectancy is flatlining while other countries see rises.
A worsening and increasingly expensive health dynamic makes the environment ripe for disruption and is allowing for new ideas to be brought to the table.
In addition, people are already responding to these inefficient practices by shifting greater emphasis on health within the job market. For example, studies show that workers care more about healthcare benefits over the salaries when choosing an employer.
Going forward, employees will gravitate towards employers that provide standout health benefits like workplace healthcare options offered by operational health. Here are some additional factors that act as catalysts for this space.
1. Healthcare as Smart Business
What do companies that rank as some of the best to work for have in common? First, they all tend to outperform relative to the S&P 500 on a cumulative stock performance basis. Second, many offer superior healthcare benefits.
Moreover, from 2012 to 2022, companies that were the best to work for saw shares appreciate nearly 500%, compared to around 300% for the broader market. Data like this suggests investing in healthcare and keeping employees happy is smart business that pays dividends.
2. Healthcare as a Differentiator
Since 2020, labor markets have changed dramatically. As a result, employees now have more options and are much more selective about where they work. This is evident from the difference between job openings and hires which has risen to unrecognizable levels. For example, the data shows that there are nearly 12 million job openings, but only around 6-7 million hires in 2022.
Altogether, with an oversupply of jobs relative to workers, employers will have to find new ways to differentiate. One way to stand out is through healthcare and initiatives around operational health tech.
3. The Looming Mental Health Epidemic
Today some 700 million people suffer from some form of a mental health condition and COVID-19 has continued to exacerbate the problem.
Moreover, the cost of mental health for the global economy is estimated to be a whopping $6 trillion by 2030, over double compared to the $2.5 trillion figure in 2010.
Under the umbrella of services operational health tech covers, mental health will stand to benefit. Especially in the years to come as we look for new ways to combat its mounting costs.
Investing in Operational Health Tech
Bloom Health Partners is an operational health tech company looking to revolutionize workplace health by supplying employers with data to better understand their employee base and business.
One way Bloom stands out is with Bloom Shield—its flagship cloud-based big data platform for employee health data management. With Bloom Shield, new health insights become available to make better decisions. Employers can get insight into demographic data and age trends within the workplace, pre-screening detection for cancer and diabetes, and testing for management to tackle the spread of disease.
Click here to learn more about investing in operational health tech with Bloom Health Partners.
-
Money2 weeks ago
Mapping the Migration of the World’s Millionaires
-
Markets2 weeks ago
Visualizing the Coming Shift in Global Economic Power (2006-2036p)
-
Datastream3 weeks ago
Ranked: These Are 10 of the World’s Least Affordable Housing Markets
-
Demographics2 weeks ago
Mapped: A Decade of Population Growth and Decline in U.S. Counties
-
Misc3 weeks ago
Visualizing Well-Known Airlines by Fleet Composition
-
Markets4 weeks ago
Ranked: Visualizing the Largest Trading Partners of the U.S.
-
Misc1 week ago
Iconic Infographic Map Compares the World’s Mountains and Rivers
-
Energy2 weeks ago
Explainer: What Drives Gasoline Prices?