Energy
Measuring the Level of Competition for Valuable Minerals
Measuring Competition for Valuable Minerals
The Chart of the Week is a weekly Visual Capitalist feature on Fridays.
Everybody loves a little competition.
It levels the playing field and ensures prices and products are kept affordable and available. But how do you measure and track the competitiveness of specific sectors?
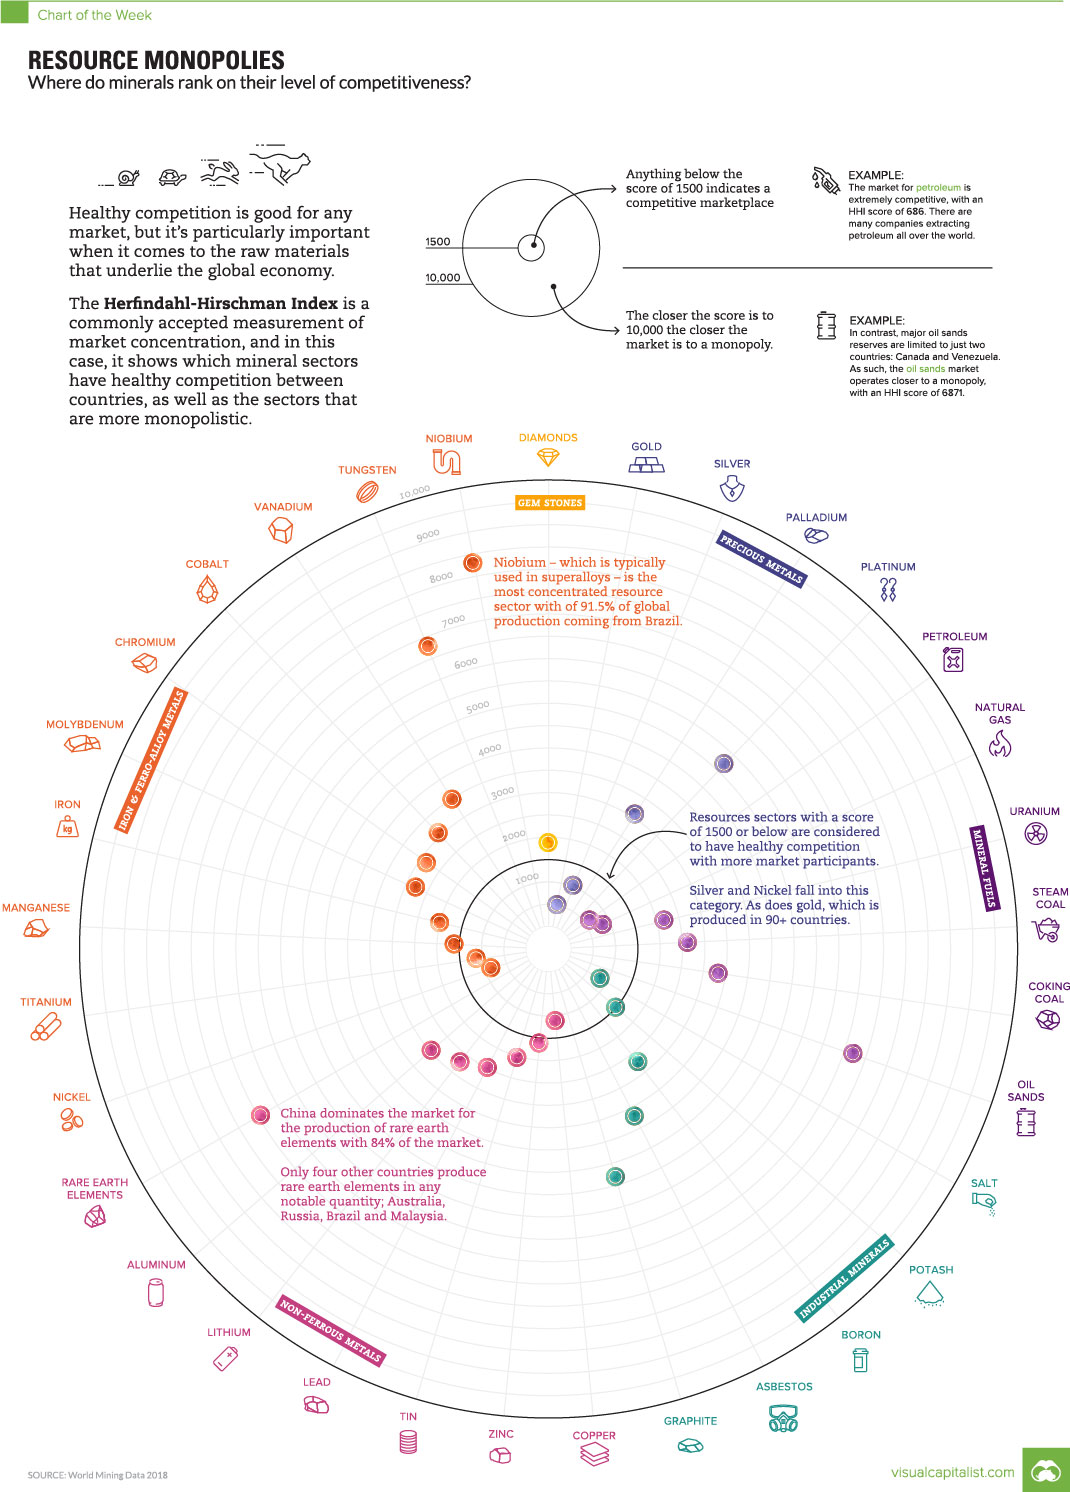
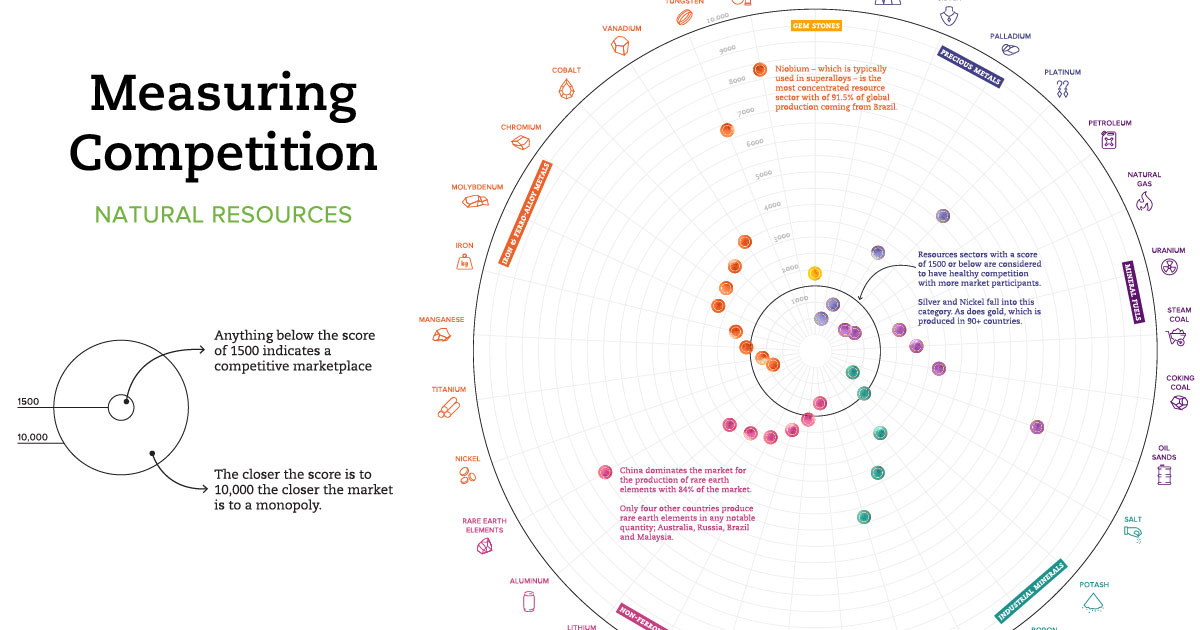
The Herfindahl-Hirschman Index (HHI) is a commonly accepted measurement of market concentration, and in today’s case, we use it to show which mineral sectors have healthy competition between countries, as well as the sectors that are more monopolistic.
What is the Herfindahl-Hirschman Index?
The HHI is calculated by squaring the market share of each competitor and then summing up the resulting numbers. It can range from zero to 10,000.
The closer a market is to a monopoly, the higher the market’s concentration, and the lower its competition. If there were only one company in an industry, that company would have a 100% share of the market, and the HHI would equal 10,000, demonstrating a monopoly.
Conversely, if there were thousands of firms competing, the HHI would be near zero, indicating almost perfect competition.
- HHI below 1,500: a competitive marketplace
- HHI between 1,500 – 2,500: a moderately concentrated marketplace
- HHI of 2,500 or greater: a highly concentrated marketplace
Interestingly, the same technique is also used by the U.S. Department of Justice to look at market competition and potential anti-trust violators, as well.
Global Metal Production
Today’s chart uses data from the World Mining Congress to look at the competition for global minerals between countries. The HHI scores show the minerals most and least exposed to competition, while uncovering opportunities for countries looking to bolster their own mineral production.
Here are 33 minerals ranked, going from highest score (most monopolistic) to lowest (least monopolistic):
| Rank | Mineral | HHI Score | Type of Mineral |
|---|---|---|---|
| #1 | Niobium (Nb2O5) | 8,413 | Iron and Ferro-Alloy Metals |
| #2 | REE (Rare Earth Elements) | 7,219 | Non-Ferrous Metals |
| #3 | Oil Sands | 6,871 | Mineral Fuels |
| #4 | Tungsten (W) | 6,828 | Iron and Ferro-Alloy Metals |
| #5 | Platinum (Pt) | 5,383 | Precious Metals |
| #6 | Graphite | 4,990 | Industrial Minerals |
| #7 | Asbestos | 3,738 | Industrial Minerals |
| #8 | Vanadium (V) | 3,573 | Iron and Ferro-Alloy Metals |
| #9 | Coking Coal | 3,423 | Mineral Fuels |
| #10 | Cobalt (Co) | 3,184 | Iron and Ferro-Alloy Metals |
| #11 | Palladium (Pd) | 3,163 | Precious Metals |
| #12 | Aluminum (Al) | 3,078 | Non-Ferrous Metals |
| #13 | Chromium (Cr2O3) | 2,942 | Iron and Ferro-Alloy Metals |
| #14 | Molybdenum (Mo) | 2,812 | Iron and Ferro-Alloy Metals |
| #15 | Boron (B) | 2,749 | Industrial Minerals |
| #16 | Lithium (Li2O) | 2,749 | Non-Ferrous Metals |
| #17 | Steam Coal | 2,639 | Mineral Fuels |
| #18 | Lead (Pb) | 2,505 | Non-Ferrous Metals |
| #19 | Uranium (U308) | 2,233 | Mineral Fuels |
| #20 | Tin (Sn) | 2,036 | Non-Ferrous Metals |
| #21 | Iron (Fe) | 2,015 | Iron and Ferro-Alloy Metals |
| #22 | Diamond | 1,904 | Gemstones |
| #23 | Zinc (Zn) | 1,687 | Non-Ferrous Metals |
| #24 | Manganese (Mn) | 1,627 | Iron and Ferro-Alloy Metals |
| #25 | Potash | 1,565 | Industrial Minerals |
| #26 | Copper (Cu) | 1,136 | Non-Ferrous Metals |
| #27 | Titanium (TIO2) | 1,120 | Iron and Ferro-Alloy Metals |
| #28 | Silver (Ag) | 1,015 | Precious Metals |
| #29 | Salt (NaCl) | 982 | Industrial Minerals |
| #30 | Nickel (Ni) | 949 | Iron and Ferro-Alloy Metals |
| #31 | Natural Gas | 884 | Mineral Fuels |
| #32 | Petroleum | 686 | Mineral Fuels |
| #33 | Gold (Au) | 557 | Precious Metals |
The data here makes it clear that mineral production is not uniformly distributed throughout the world, giving some countries huge advantages while revealing potential supply problems down the road.
Renewables in the Spotlight
While commodities like gold and oil have robust levels of competition around the world, the renewable energy industry relies on more obscure raw materials to make solar, wind, and EVs work.
Rare earth elements (REE) rank #2 on the list with a HHI score of 7,219, while battery minerals such as graphite (#6), vanadium (#8), cobalt (#10), and lithium (#16) also appear high on the list as well.
According to a recent study, the production of rare earth elements is an area of particular concern. Used in everything from electric motors to wind turbines, rare earth demand will need to increase by twelve times by 2050 to reach emissions targets set by the Paris Agreement.
The only problem is that China currently controls 84% of global production, which increases the odds of bottlenecks and scarcity as demand rises. This ultimately creates an interesting scenario, where a sustainable future will be at the mercy of a few a producing nations.


Energy
Charted: 4 Reasons Why Lithium Could Be the Next Gold Rush
Visual Capitalist has partnered with EnergyX to show why drops in prices and growing demand may make now the right time to invest in lithium.


4 Reasons Why You Should Invest in Lithium
Lithium’s importance in powering EVs makes it a linchpin of the clean energy transition and one of the world’s most precious minerals.
In this graphic, Visual Capitalist partnered with EnergyX to explore why now may be the time to invest in lithium.
1. Lithium Prices Have Dropped
One of the most critical aspects of evaluating an investment is ensuring that the asset’s value is higher than its price would indicate. Lithium is integral to powering EVs, and, prices have fallen fast over the last year:
| Date | LiOH·H₂O* | Li₂CO₃** |
|---|---|---|
| Feb 2023 | $76 | $71 |
| March 2023 | $71 | $61 |
| Apr 2023 | $43 | $33 |
| May 2023 | $43 | $33 |
| June 2023 | $47 | $45 |
| July 2023 | $44 | $40 |
| Aug 2023 | $35 | $35 |
| Sept 2023 | $28 | $27 |
| Oct 2023 | $24 | $23 |
| Nov 2023 | $21 | $21 |
| Dec 2023 | $17 | $16 |
| Jan 2024 | $14 | $15 |
| Feb 2024 | $13 | $14 |
Note: Monthly spot prices were taken as close to the 14th of each month as possible.
*Lithium hydroxide monohydrate MB-LI-0033
**Lithium carbonate MB-LI-0029
2. Lithium-Ion Battery Prices Are Also Falling
The drop in lithium prices is just one reason to invest in the metal. Increasing economies of scale, coupled with low commodity prices, have caused the cost of lithium-ion batteries to drop significantly as well.
In fact, BNEF reports that between 2013 and 2023, the price of a Li-ion battery dropped by 82%.
| Year | Price per KWh |
|---|---|
| 2023 | $139 |
| 2022 | $161 |
| 2021 | $150 |
| 2020 | $160 |
| 2019 | $183 |
| 2018 | $211 |
| 2017 | $258 |
| 2016 | $345 |
| 2015 | $448 |
| 2014 | $692 |
| 2013 | $780 |

3. EV Adoption is Sustainable
One of the best reasons to invest in lithium is that EVs, one of the main drivers behind the demand for lithium, have reached a price point similar to that of traditional vehicle.
According to the Kelly Blue Book, Tesla’s average transaction price dropped by 25% between 2022 and 2023, bringing it in line with many other major manufacturers and showing that EVs are a realistic transport option from a consumer price perspective.
| Manufacturer | September 2022 | September 2023 |
|---|---|---|
| BMW | $69,000 | $72,000 |
| Ford | $54,000 | $56,000 |
| Volkswagon | $54,000 | $56,000 |
| General Motors | $52,000 | $53,000 |
| Tesla | $68,000 | $51,000 |
4. Electricity Demand in Transport is Growing
As EVs become an accessible transport option, there’s an investment opportunity in lithium. But possibly the best reason to invest in lithium is that the IEA reports global demand for the electricity in transport could grow dramatically by 2030:
| Transport Type | 2022 | 2025 | 2030 |
|---|---|---|---|
| Buses 🚌 | 23,000 GWh | 50,000 GWh | 130,000 GWh |
| Cars 🚙 | 65,000 GWh | 200,000 GWh | 570,000 GWh |
| Trucks 🛻 | 4,000 GWh | 15,000 GWh | 94,000 GWh |
| Vans 🚐 | 6,000 GWh | 16,000 GWh | 72,000 GWh |
The Lithium Investment Opportunity
Lithium presents a potentially classic investment opportunity. Lithium and battery prices have dropped significantly, and recently, EVs have reached a price point similar to other vehicles. By 2030, the demand for clean energy, especially in transport, will grow dramatically.
With prices dropping and demand skyrocketing, now is the time to invest in lithium.
EnergyX is poised to exploit lithium demand with cutting-edge lithium extraction technology capable of extracting 300% more lithium than current processes.

-

 Lithium4 days ago
Ranked: The Top 10 EV Battery Manufacturers in 2023
Asia dominates this ranking of the world’s largest EV battery manufacturers in 2023.
-

 Energy1 week ago
The World’s Biggest Nuclear Energy Producers
China has grown its nuclear capacity over the last decade, now ranking second on the list of top nuclear energy producers.
-

 Energy1 month ago
The World’s Biggest Oil Producers in 2023
Just three countries accounted for 40% of global oil production last year.
-

 Energy1 month ago
How Much Does the U.S. Depend on Russian Uranium?
Currently, Russia is the largest foreign supplier of nuclear power fuel to the U.S.
-

 Uranium2 months ago
Charted: Global Uranium Reserves, by Country
We visualize the distribution of the world’s uranium reserves by country, with 3 countries accounting for more than half of total reserves.
-

 Energy3 months ago
Visualizing the Rise of the U.S. as Top Crude Oil Producer
Over the last decade, the United States has established itself as the world’s top producer of crude oil, surpassing Saudi Arabia and Russia.

-

 Debt1 week ago
How Debt-to-GDP Ratios Have Changed Since 2000
-

 Markets2 weeks ago
Ranked: The World’s Top Flight Routes, by Revenue
-

 Countries2 weeks ago
Population Projections: The World’s 6 Largest Countries in 2075
-

 Markets2 weeks ago
The Top 10 States by Real GDP Growth in 2023
-

 Demographics2 weeks ago
The Smallest Gender Wage Gaps in OECD Countries
-

 United States2 weeks ago
Where U.S. Inflation Hit the Hardest in March 2024
-

 Green2 weeks ago
Top Countries By Forest Growth Since 2001
-

 United States2 weeks ago
Ranked: The Largest U.S. Corporations by Number of Employees