The world's three biggest religions have a combined 5 billion followers. We rank the most popular religions, based on recent...


click for more →


Scan with your phone's camera or QR code app to view

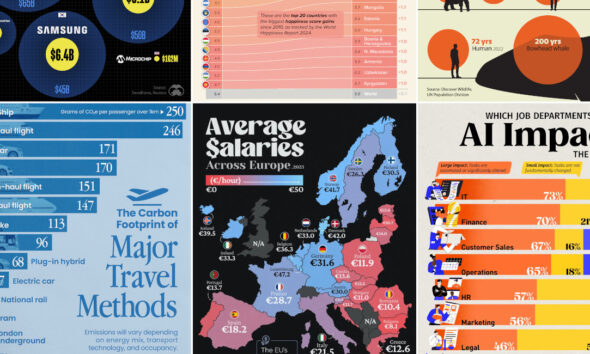
A countdown of our top infographics from the last year, including some of our most viewed graphics as well as other hand-picked entries from our staff.
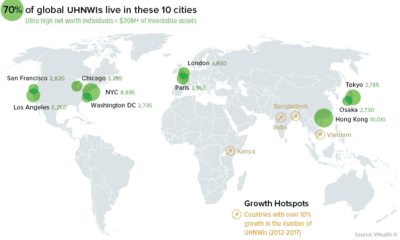

A data-driven snapshot of global wealth distribution. The average person around the world is doing better, but big-picture inequality is still staggering.
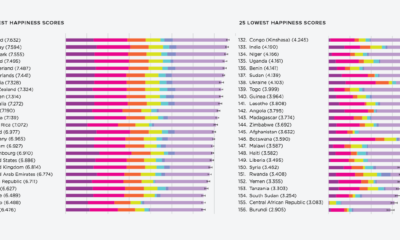

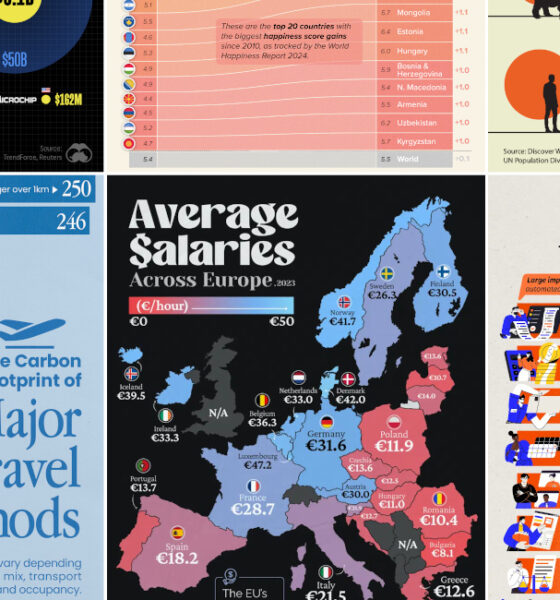
What contributes to happiness? These charts break down global happiness scores - how does your country fare, and how has it changed over ten years?
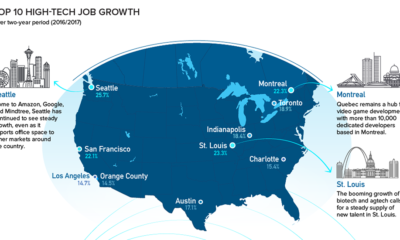

Silicon Valley is no longer the only place to be for a career in tech. Here are the fastest growing tech markets across North America, and...
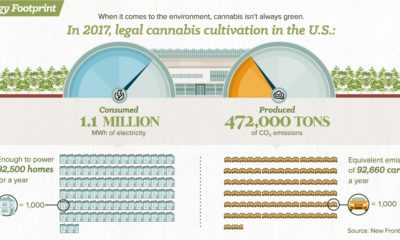

Legal cannabis cultivation emits as much CO2 as 92,660 cars annually. Growing cannabis sustainably can reduce this massive environmental footprint.
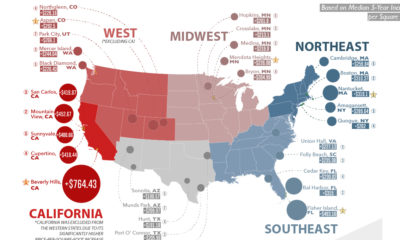

Here are the biggest increases in median housing prices (per sq. ft) over the last 5 years. See where real estate prices are rising (and falling)...
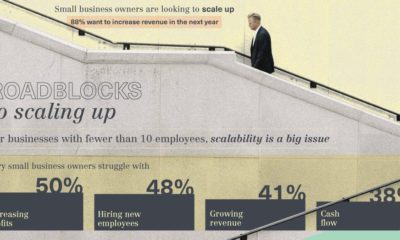

What are the roadblocks to achieving scale? We look at these growing pains, as well as the steps needed to get past them in scaling your...
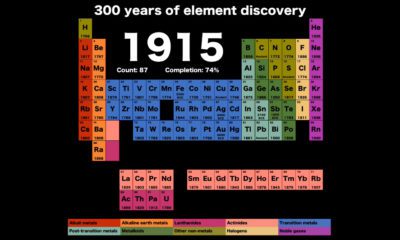

Watch discoveries of new elements as the years flip by, in this short and compelling animation that shows how the periodic table has changed over 300...
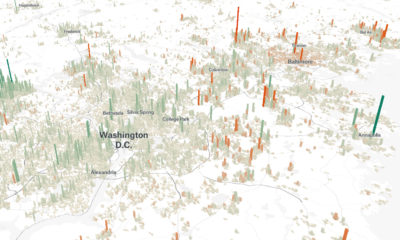

Cities are constantly evolving over time. These 3d graphics visualize both growth and decline with a focus on North American cities from 1990-2015.
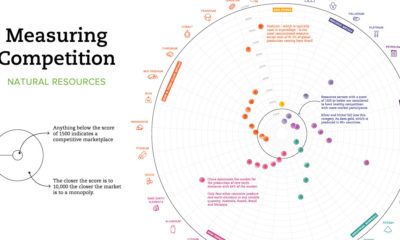

Which resource markets have healthy levels of competition, and which are more monopolistic? This chart shows the global level of competition for 33 minerals.
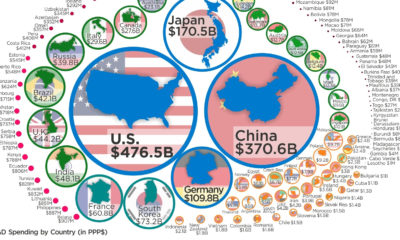

Just four countries (U.S., China, Japan, and Germany) account for nearly two-thirds of global expenditures on R&D. Here's global data on R&D visualized.
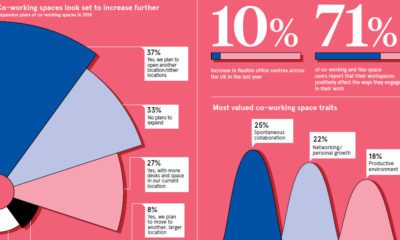

More and more startups are moving to co-working spaces, which provide a scalable office space solution. See more on why the co-working space is booming.
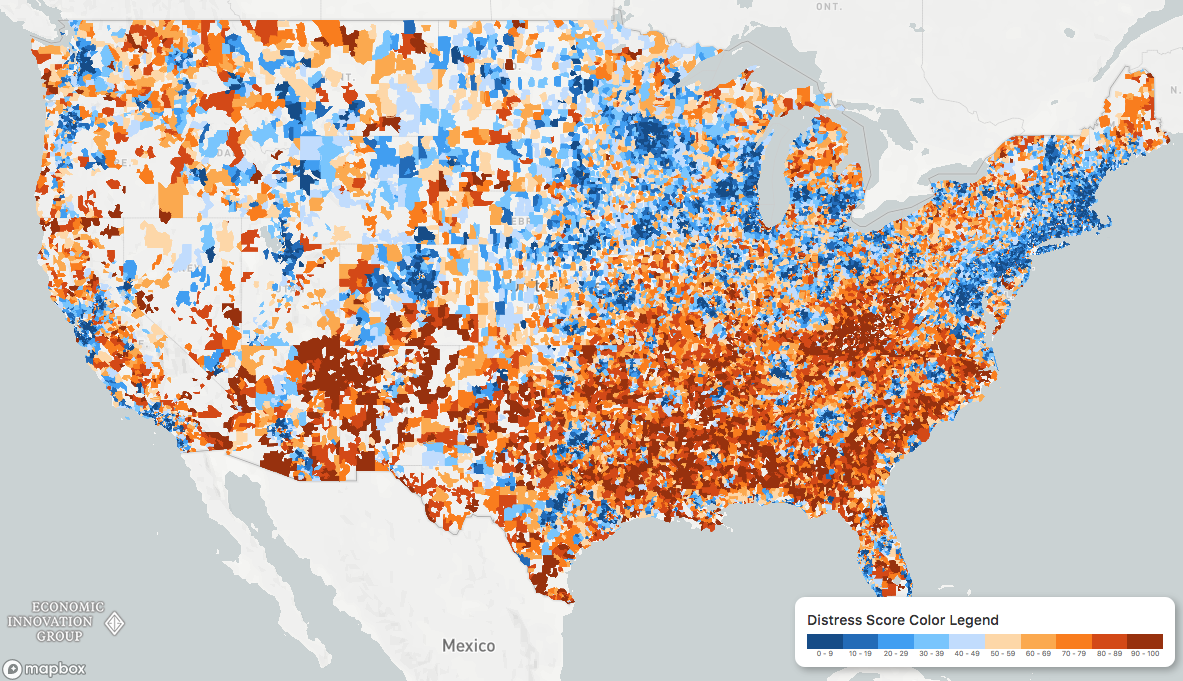
While the U.S. economic picture remains quite rosy, things change quickly when you zoom to the local level. This map shows the country's distressed communities.
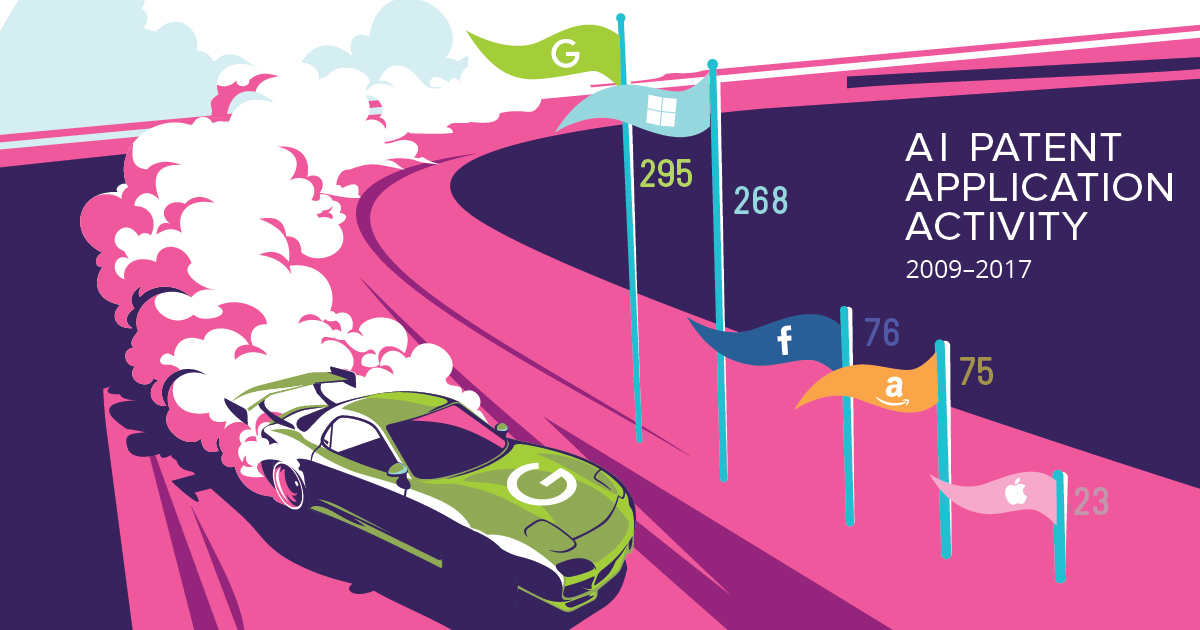
An interactive look at which tech giants and unicorns are winning in the battle for patents - including a look at patent categories and patent-leading CEOs.
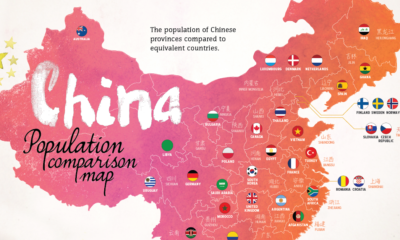

With 1.4 billion people living in the country's 33 distinct regions, each of China's provinces has a population that is equal to that of a major...
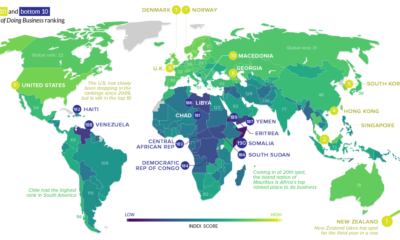

In some countries, launching a business is easy. In others? It's a hassle that is littered with bureaucracy, corruption, and a lack of basic services.


This in-depth infographic provides a practical guide on how anyone can increase privacy on their browser, social media networks, and mobile device.