Connect with us

Inequality

The Geography of America’s Distressed Communities

Published

on

Despite a recent slump in the markets, the U.S. economy is still putting up strong numbers. Unemployment is at its lowest point since the 1960s, and the U.S. manufacturing sector is thriving.

Looking beyond these big picture gains, many communities in the United States are struggling. Check cashing stores outnumber McDonald’s locations, the opioid epidemic rages on, and tens of millions are living in poverty around the country. It’s becoming more clear that the recovery from the financial crisis has been highly uneven.

The Data Behind Distress

To understand the disconnect between struggling counties and a high-flying national economy, researchers at the Economic Innovation Group (EIG) created the Distressed Communities Index:


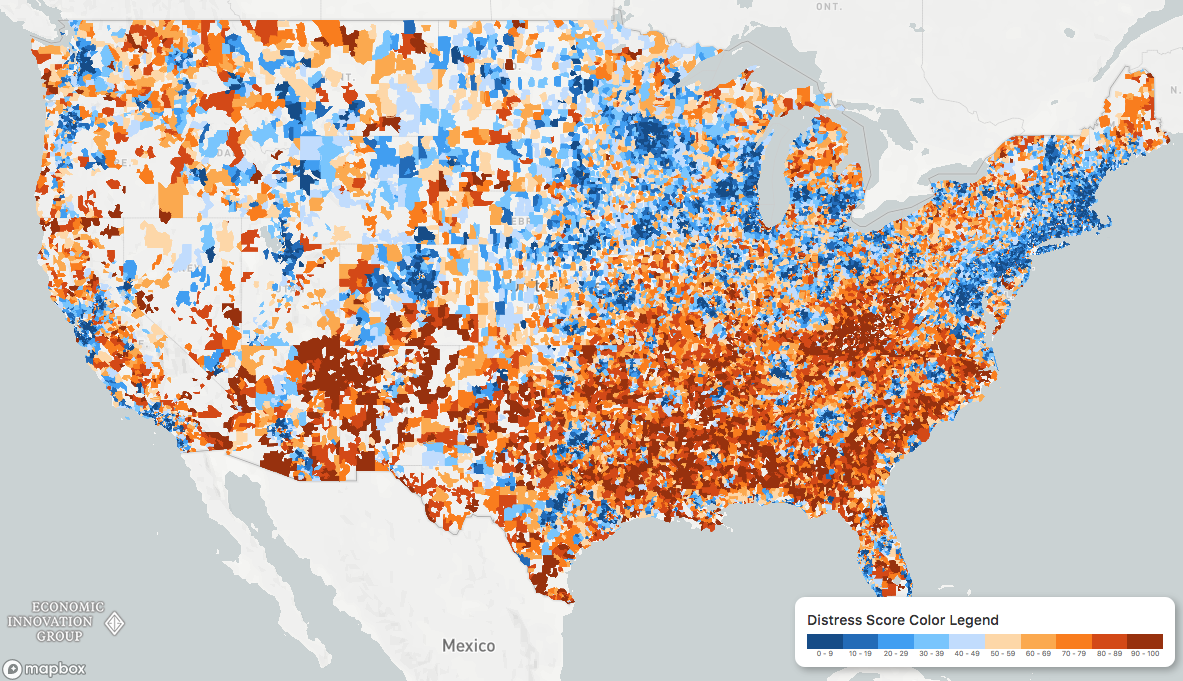
To calculate the “health” of communities around the country, the Economic Innovation Group (EIG) looked at everything from vacancy rates to median income ratios. When visualized, a picture emerges of an America divided into superstar regions and broad expanses of struggling communities.

Distressed and prosperous ZIP codes […] represent two almost diametrically opposed experiences of living in the United States.

– Distressed Communities Index Report (2018)

Community Quintiles

When communities are divided into quintiles, stark patterns emerge. In the most distressed zip codes, over 40% of “prime-age” adults are unemployed, one-in-five adults did not graduate high school, and the housing vacancy rate is nearly double the U.S. average.

DCI quintiles chart

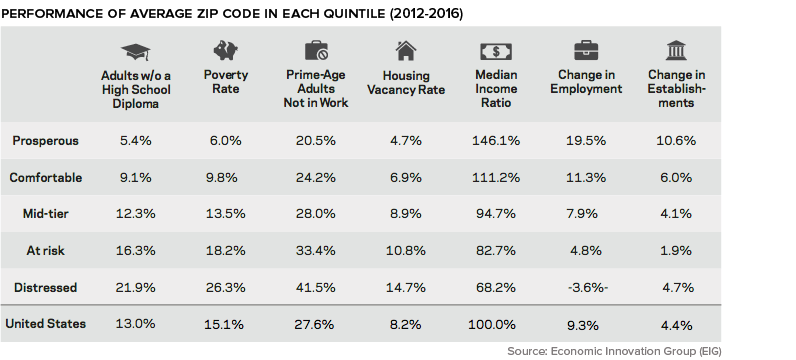
As well, deaths related to substance abuse and mental illness are 64% higher in distressed communities.

Struggling States and Cities

The DCI data reveals that those living in the lower half of the United States are more likely to call a distressed community home. In Alabama, Arkansas, Mississippi, and West Virginia, one-third or more of the population resides in the bottom quintile of zip codes.

distressed communities states map

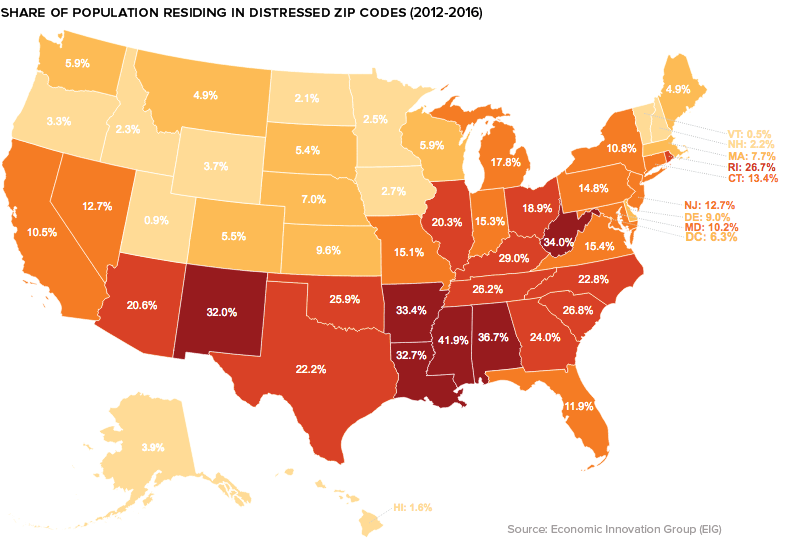
On the flip side, in Colorado, Minnesota, Massachusetts, New Hampshire, and Utah well over 40% of the population live in prosperous zip codes.

Zooming in beyond the state-level, a geographical trend becomes clear: many of the struggling communities in the index are classified as rural. Between 2007 and 2016, nearly a third of all rural zip codes were considered “downwardly mobile”, compared to only 16% of those in urban areas.

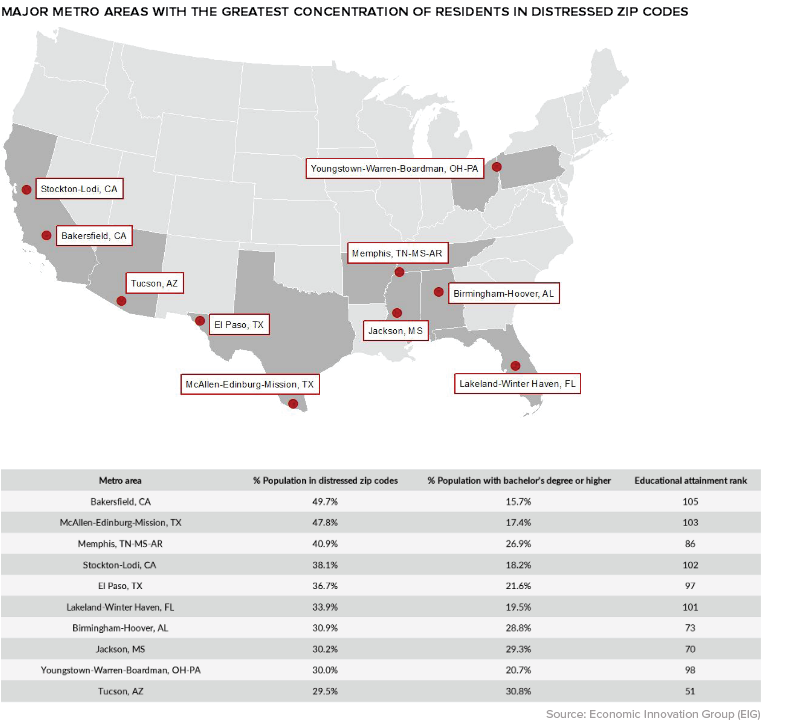
Though rural zip codes tend to fare worse than their more urban counterparts, there are exceptions to that trend. One example is Bakersfield, California, where almost half of the city’s population lives in a distressed community.

DCI cities map

Subscribe to Visual Capitalist
Click for Comments

Personal Finance

Where People Borrow Money From, by Country Income Level

These graphics shed light on which people borrow money from financial institutions, and which rely on friends and family for monetary help.

Published

on

Shareable borrow money

When making the decision to borrow money, do you turn to friends and family for financial help, or do you go to a financial institution like a bank or credit card company?

On a country-to-country basis, this choice often depends on a mix of various factors, including the availability of financial services, financial literacy, and the cultural approach to the very concept of lending itself.

In these graphics, Richie Lionell sheds some light on where people borrow money from, using the 2021 Global Findex Database published by the World Bank.

Borrowing From Financial Institutions

To compare borrowing practices across both location and income level, the dataset features survey results from respondents aged 15+ and groups countries by region except for high-income countries, which are grouped together.

borrow money from financial institutions

In 2021, most individuals in high income economies borrowed money from formal financial institutions.

CountryRegionBorrowed from a financial institution
CanadaHigh income81.01%
IsraelHigh income79.52%
IcelandHigh income73.36%
Hong Kong SAR, ChinaHigh income70.01%
Korea, Rep.High income68.64%
NorwayHigh income66.82%
United StatesHigh income66.21%
Taiwan, ChinaHigh income61.95%
SwitzerlandHigh income61.40%
JapanHigh income61.19%
New ZealandHigh income60.38%
AustraliaHigh income57.29%
AustriaHigh income56.52%
ItalyHigh income55.01%
United KingdomHigh income54.98%
GermanyHigh income54.68%
IrelandHigh income54.11%
DenmarkHigh income53.16%
FinlandHigh income52.98%
SpainHigh income51.92%
SwedenHigh income48.69%
BelgiumHigh income47.98%
FranceHigh income44.37%
SingaporeHigh income42.82%
SloveniaHigh income42.36%
UruguayHigh income42.01%
BrazilLatin America & Caribbean (excluding high income)40.75%
ChinaEast Asia & Pacific (excluding high income)39.19%
MaltaHigh income38.95%
TürkiyeEurope & Central Asia (excluding high income)37.84%
NetherlandsHigh income34.45%
Slovak RepublicHigh income34.41%
MongoliaEast Asia & Pacific (excluding high income)34.39%
UkraineEurope & Central Asia (excluding high income)34.13%
EstoniaHigh income33.64%
CroatiaHigh income33.03%
Saudi ArabiaHigh income32.38%
PolandHigh income31.92%
Czech RepublicHigh income31.33%
CyprusHigh income31.25%
CambodiaEast Asia & Pacific (excluding high income)30.89%
ArgentinaLatin America & Caribbean (excluding high income)30.81%
PortugalHigh income30.44%
KazakhstanEurope & Central Asia (excluding high income)29.76%
Russian FederationEurope & Central Asia (excluding high income)29.75%
ThailandEast Asia & Pacific (excluding high income)28.26%
BulgariaEurope & Central Asia (excluding high income)26.36%
ArmeniaEurope & Central Asia (excluding high income)26.17%
Iran, Islamic Rep.Middle East & North Africa (excluding high income)25.11%
ChileHigh income24.20%
GeorgiaEurope & Central Asia (excluding high income)23.89%
EcuadorLatin America & Caribbean (excluding high income)23.23%
LatviaHigh income22.74%
United Arab EmiratesHigh income22.46%
KenyaSub-Saharan Africa (excluding high income)22.18%
North MacedoniaEurope & Central Asia (excluding high income)22.10%
PeruLatin America & Caribbean (excluding high income)21.95%
Dominican RepublicLatin America & Caribbean (excluding high income)21.65%
Bosnia and HerzegovinaEurope & Central Asia (excluding high income)21.30%
Sri LankaSouth Asia21.29%
NamibiaSub-Saharan Africa (excluding high income)20.97%
SerbiaEurope & Central Asia (excluding high income)20.65%
GreeceHigh income20.11%
MauritiusSub-Saharan Africa (excluding high income)20.09%
BoliviaLatin America & Caribbean (excluding high income)19.30%
RomaniaEurope & Central Asia (excluding high income)19.14%
HungaryHigh income18.93%
UgandaSub-Saharan Africa (excluding high income)18.62%
South AfricaSub-Saharan Africa (excluding high income)18.22%
ColombiaLatin America & Caribbean (excluding high income)18.10%
Kyrgyz RepublicEurope & Central Asia (excluding high income)17.73%
KosovoEurope & Central Asia (excluding high income)17.61%
Costa RicaLatin America & Caribbean (excluding high income)17.46%
PhilippinesEast Asia & Pacific (excluding high income)17.45%
LiberiaSub-Saharan Africa (excluding high income)15.42%
BangladeshSouth Asia14.22%
NepalSouth Asia14.11%
MalaysiaEast Asia & Pacific (excluding high income)13.48%
AlbaniaEurope & Central Asia (excluding high income)13.39%
MoldovaEurope & Central Asia (excluding high income)13.18%
IndonesiaEast Asia & Pacific (excluding high income)12.86%
TajikistanEurope & Central Asia (excluding high income)12.43%
ParaguayLatin America & Caribbean (excluding high income)12.39%
NicaraguaLatin America & Caribbean (excluding high income)12.19%
JamaicaLatin America & Caribbean (excluding high income)12.04%
LithuaniaHigh income11.95%
IndiaSouth Asia11.79%
MaliSub-Saharan Africa (excluding high income)10.99%
El SalvadorLatin America & Caribbean (excluding high income)10.56%
PanamaLatin America & Caribbean (excluding high income)10.39%
HondurasLatin America & Caribbean (excluding high income)10.32%
MozambiqueSub-Saharan Africa (excluding high income)10.27%
SenegalSub-Saharan Africa (excluding high income)9.98%
TunisiaMiddle East & North Africa (excluding high income)9.89%
JordanMiddle East & North Africa (excluding high income)9.86%
Lao PDREast Asia & Pacific (excluding high income)9.15%
Venezuela, RBLatin America & Caribbean (excluding high income)8.83%
BeninSub-Saharan Africa (excluding high income)8.21%
MalawiSub-Saharan Africa (excluding high income)7.99%
UzbekistanEurope & Central Asia (excluding high income)7.50%
TogoSub-Saharan Africa (excluding high income)7.42%
GhanaSub-Saharan Africa (excluding high income)7.40%
Egypt, Arab Rep.Middle East & North Africa (excluding high income)7.30%
MyanmarEast Asia & Pacific (excluding high income)7.06%
CameroonSub-Saharan Africa (excluding high income)6.99%
ZambiaSub-Saharan Africa (excluding high income)6.76%
Burkina FasoSub-Saharan Africa (excluding high income)6.66%
NigeriaSub-Saharan Africa (excluding high income)6.40%
Congo, Rep.Sub-Saharan Africa (excluding high income)6.19%
GuineaSub-Saharan Africa (excluding high income)6.11%
GabonSub-Saharan Africa (excluding high income)5.48%
MoroccoMiddle East & North Africa (excluding high income)4.99%
West Bank and GazaMiddle East & North Africa (excluding high income)4.94%
TanzaniaSub-Saharan Africa (excluding high income)4.45%
Sierra LeoneSub-Saharan Africa (excluding high income)4.29%
Cote d'IvoireSub-Saharan Africa (excluding high income)4.10%
AlgeriaMiddle East & North Africa (excluding high income)3.80%
IraqMiddle East & North Africa (excluding high income)3.64%
PakistanSouth Asia3.51%
LebanonMiddle East & North Africa (excluding high income)3.31%
ZimbabweSub-Saharan Africa (excluding high income)2.89%
South SudanSub-Saharan Africa (excluding high income)2.48%
AfghanistanSouth Asia2.05%

With 81% of respondents borrowing from financial institutions, Canada tops this list. Meanwhile, Israel (80%), Iceland (73%), Hong Kong (70%), and South Korea (69%) are not far behind.

This is not surprising for richer nations, as financial services in these countries are more available and accessible. This, coupled with higher financial literacy, including a general understanding of interest rates and credit-building opportunities, contribute to the popularity of financial institutions.

Also, it’s worth noting that some countries have cultural practices that factor in. For example, 61% of respondents in Japan used formal financial institutions, which are a more socially acceptable option than asking to borrow money from friends and family (just 6% of people in Japan).

Borrowing from Friends and Family

In contrast, more individuals in lower income economies approached family and friends in order to borrow money.

Countries leading in borrowing money from family and friends

Afghanistan tops this list with 60% of respondents relying on friends and family, compared to only 2% borrowing money from formal financial institutions.

CountryRegionBorrowed from family or friends
AfghanistanSouth Asia60.18%
UgandaSub-Saharan Africa (excluding high income)57.45%
KenyaSub-Saharan Africa (excluding high income)54.40%
NamibiaSub-Saharan Africa (excluding high income)50.25%
MoroccoMiddle East & North Africa (excluding high income)48.73%
NigeriaSub-Saharan Africa (excluding high income)44.71%
South AfricaSub-Saharan Africa (excluding high income)44.54%
IraqMiddle East & North Africa (excluding high income)44.10%
CameroonSub-Saharan Africa (excluding high income)43.49%
ZambiaSub-Saharan Africa (excluding high income)43.08%
ZimbabweSub-Saharan Africa (excluding high income)42.34%
GuineaSub-Saharan Africa (excluding high income)42.04%
NepalSouth Asia41.79%
JordanMiddle East & North Africa (excluding high income)41.76%
GabonSub-Saharan Africa (excluding high income)41.41%
LiberiaSub-Saharan Africa (excluding high income)41.37%
TunisiaMiddle East & North Africa (excluding high income)41.05%
PhilippinesEast Asia & Pacific (excluding high income)40.82%
TürkiyeEurope & Central Asia (excluding high income)40.80%
Iran, Islamic Rep.Middle East & North Africa (excluding high income)39.80%
Sierra LeoneSub-Saharan Africa (excluding high income)39.02%
GhanaSub-Saharan Africa (excluding high income)38.58%
Egypt, Arab Rep.Middle East & North Africa (excluding high income)37.75%
Saudi ArabiaHigh income35.76%
BangladeshSouth Asia35.49%
MaliSub-Saharan Africa (excluding high income)35.15%
Burkina FasoSub-Saharan Africa (excluding high income)35.14%
CambodiaEast Asia & Pacific (excluding high income)34.85%
Venezuela, RBLatin America & Caribbean (excluding high income)34.81%
TogoSub-Saharan Africa (excluding high income)33.99%
West Bank and GazaMiddle East & North Africa (excluding high income)33.93%
ThailandEast Asia & Pacific (excluding high income)32.83%
Lao PDREast Asia & Pacific (excluding high income)32.36%
MoldovaEurope & Central Asia (excluding high income)32.18%
UkraineEurope & Central Asia (excluding high income)32.17%
SenegalSub-Saharan Africa (excluding high income)31.30%
ArmeniaEurope & Central Asia (excluding high income)31.29%
IndiaSouth Asia31.02%
BoliviaLatin America & Caribbean (excluding high income)30.69%
AlgeriaMiddle East & North Africa (excluding high income)30.52%
Cote d'IvoireSub-Saharan Africa (excluding high income)30.20%
AlbaniaEurope & Central Asia (excluding high income)30.00%
BulgariaEurope & Central Asia (excluding high income)29.99%
BeninSub-Saharan Africa (excluding high income)29.33%
MozambiqueSub-Saharan Africa (excluding high income)29.33%
TanzaniaSub-Saharan Africa (excluding high income)29.24%
ColombiaLatin America & Caribbean (excluding high income)29.08%
IndonesiaEast Asia & Pacific (excluding high income)28.85%
South SudanSub-Saharan Africa (excluding high income)28.84%
EcuadorLatin America & Caribbean (excluding high income)28.79%
SerbiaEurope & Central Asia (excluding high income)28.49%
Russian FederationEurope & Central Asia (excluding high income)28.40%
MongoliaEast Asia & Pacific (excluding high income)27.01%
Kyrgyz RepublicEurope & Central Asia (excluding high income)27.01%
ChinaEast Asia & Pacific (excluding high income)26.43%
HondurasLatin America & Caribbean (excluding high income)26.07%
GreeceHigh income25.94%
KosovoEurope & Central Asia (excluding high income)25.86%
ArgentinaLatin America & Caribbean (excluding high income)25.72%
KazakhstanEurope & Central Asia (excluding high income)25.64%
RomaniaEurope & Central Asia (excluding high income)25.58%
MalawiSub-Saharan Africa (excluding high income)25.24%
North MacedoniaEurope & Central Asia (excluding high income)25.14%
Dominican RepublicLatin America & Caribbean (excluding high income)24.70%
BrazilLatin America & Caribbean (excluding high income)24.66%
Congo, Rep.Sub-Saharan Africa (excluding high income)24.40%
LebanonMiddle East & North Africa (excluding high income)24.26%
NicaraguaLatin America & Caribbean (excluding high income)23.75%
IcelandHigh income23.63%
PeruLatin America & Caribbean (excluding high income)23.34%
United Arab EmiratesHigh income23.04%
MyanmarEast Asia & Pacific (excluding high income)23.03%
Sri LankaSouth Asia22.53%
ParaguayLatin America & Caribbean (excluding high income)22.20%
PakistanSouth Asia21.87%
UzbekistanEurope & Central Asia (excluding high income)21.53%
CyprusHigh income20.95%
Bosnia and HerzegovinaEurope & Central Asia (excluding high income)20.94%
ChileHigh income20.72%
GeorgiaEurope & Central Asia (excluding high income)20.61%
MauritiusSub-Saharan Africa (excluding high income)20.48%
Costa RicaLatin America & Caribbean (excluding high income)20.29%
JamaicaLatin America & Caribbean (excluding high income)20.02%
TajikistanEurope & Central Asia (excluding high income)19.86%
PolandHigh income19.34%
NorwayHigh income19.29%
United StatesHigh income18.09%
UruguayHigh income17.60%
PanamaLatin America & Caribbean (excluding high income)17.54%
DenmarkHigh income17.51%
CroatiaHigh income17.09%
El SalvadorLatin America & Caribbean (excluding high income)16.78%
SloveniaHigh income16.77%
LatviaHigh income16.57%
AustraliaHigh income16.44%
EstoniaHigh income15.74%
MalaysiaEast Asia & Pacific (excluding high income)15.44%
IsraelHigh income15.43%
New ZealandHigh income15.19%
Slovak RepublicHigh income15.02%
GermanyHigh income15.01%
AustriaHigh income14.41%
CanadaHigh income14.00%
FinlandHigh income13.43%
Czech RepublicHigh income13.41%
Korea, Rep.High income13.16%
MaltaHigh income12.99%
BelgiumHigh income12.13%
SwedenHigh income11.79%
HungaryHigh income11.15%
LithuaniaHigh income10.65%
SpainHigh income10.44%
FranceHigh income10.42%
NetherlandsHigh income10.24%
IrelandHigh income9.84%
Taiwan, ChinaHigh income9.70%
PortugalHigh income8.22%
Hong Kong SAR, ChinaHigh income7.59%
JapanHigh income6.43%
SwitzerlandHigh income6.10%
United KingdomHigh income5.24%
ItalyHigh income5.06%
SingaporeHigh income1.89%

Many individuals in African countries including Uganda (57%), Kenya (54%), Namibia (50%), and Morocco (49%) also are choosing to borrow money from friends and family over financial institutions.

These preferences can be attributed to various factors including a lack of trust in banking and financial institutions, lacking access to such services, or the lack of information about such services if they are available.

And in some societies, borrowing from friends and family can be seen as a cultural norm, especially in places where mutual support and solidarity play a strong role.

What’s Next?

As viewed by the World Bank, financial inclusion is an important foundation of any nation’s development, and it’s also one of the UN’s Sustainable Development Goals. Increasing levels of financial inclusion helps give people access to services like savings plans, credit avenues, and online payments and transactions.

And thanks to commitments from countries and financial systems, global ownership of banking accounts has increased significantly (and been further spurred by the COVID-19 pandemic). According to the Global Findex Database, bank account ownership has risen to 76% in 2021, up from just 51% a decade prior.

However, access to these services is still rife with gaps when it comes to low income nations, low income individuals, and unequal access based on gender. The future of borrowing now relies on how nations deal with these challenges.

Continue Reading

Subscribe

Popular