Misc
300 Years of Element Discovery in 99 Seconds
300 Years of Element Discovery in 99 Seconds
Chemical elements are the building blocks of modern society.
Our fundamental understanding of the periodic table has allowed us to: build rockets that can withstand scorching temperatures; harness permanent magnets that can help us generate electricity; erect ultra strong and tall skyscrapers; and discover compounds that can eradicate disease around the world.
But while we take this elemental knowledge for granted today, there was a time not too long ago when the periodic table was mostly empty.
The Elemental Dark Age
Today’s animation comes to us from materials scientist Dr. Jamie Gallagher and it chronicles the last three centuries of discoveries for the periodic table of elements.
It starts in the year 1718, around time of Isaac Newton, when the scientific method was young and the knowledge we had around chemistry was still very incomplete.
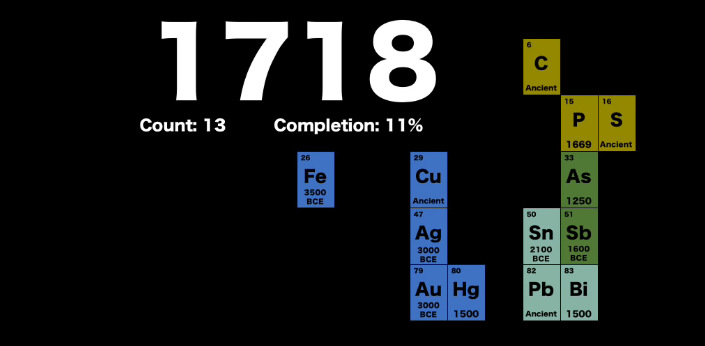
At the time, we knew about elements like iron, copper, gold, silver, and lead – but the periodic table contained just 11% of elements compared to today.
A Flurry of New Discoveries
In the late 18th century and early 19th century, researchers started seeing patterns that allowed them to make new discoveries.
Specifically, the years between 1788-1825 were particularly fruitful – over this stretch, the periodic table more than doubled in size from 26 to 53 elements.
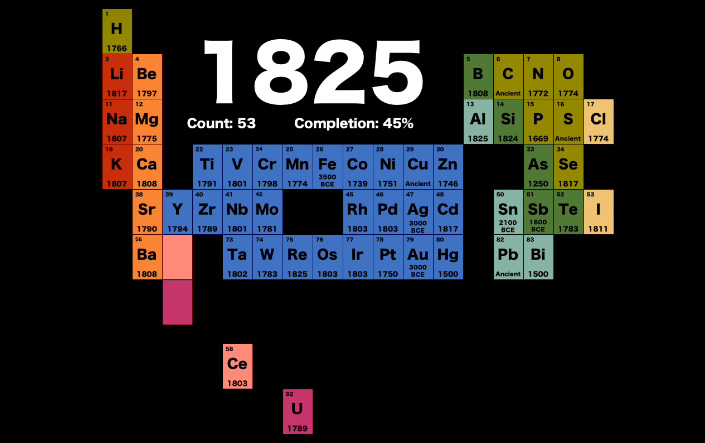
Lithium, calcium, titanium, vanadium, tungsten, palladium, silicon, niobium, and uranium were some of the elements to join the table during this critical time period.
Formation of the Periodic Table
In the 19th century, the French geologist Alexandre-Emile Béguyer de Chancourtois was the first to notice the periodicity of elements, and in 1862 devised an early version of the periodic table.
A few years later, in 1869, Russian chemist Dmitri Mendeleev created a table organized by atomic mass, which more closely resembles the one we use today.
Here were the elements known at the time:
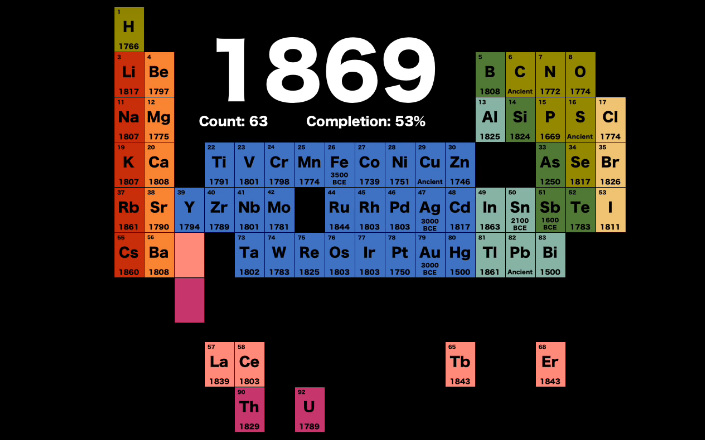
While nowhere near complete, it includes many of the elements that are used in modern life today.
The Final Touches
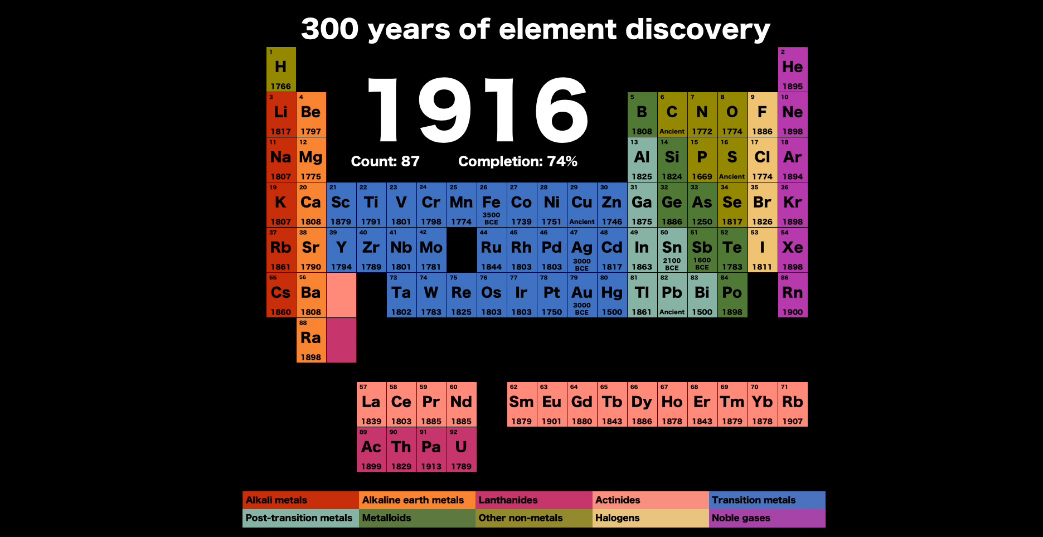
By the 20th century, chemistry was becoming more formalized, as we knew more about atoms, protons, electrons, neutrons, and so on. This led to the fleshing out of the periodic table as we know it.
By this point, researchers were even creating radioactive, synthetic elements like unununium (Atomic number 111) which is now known as Roentgenium. Like many other late element discoveries, this one is not found in nature and the most common isotope has a half-life of just 100 seconds.
These final discoveries, some of which happened in recent decades, helped bring up the periodic table to its current size: 118 elements.


Misc
Visualizing the Most Common Pets in the U.S.
Lions, tigers, and bears, oh my!—these animals do not feature on this list of popular American household pets.


Visualizing The Most Common Pets in the U.S.
This was originally posted on our Voronoi app. Download the app for free on iOS or Android and discover incredible data-driven charts from a variety of trusted sources.
In this graphic, we visualized the most common American household pets, based on 2023-2024 data from the American Pet Products Association (accessed via Forbes Advisor).
Figures represent the number of households that own each pet type, rather than the actual number of each animal. The “small animal” category includes hamsters, gerbils, rabbits, guinea pigs, chinchillas, mice, rats, and ferrets.
What is the Most Popular American Household Pet?
Based on this data, dogs—one of the first domesticated animals—are the most common pets in the United States. In fact, around 65 million households own a dog, and spend an average of $900 a year on their care.
| Rank | Species | Households |
|---|---|---|
| 1 | 🐶 Dog | 65M |
| 2 | 🐱 Cat | 47M |
| 3 | 🐟 Freshwater Fish | 11M |
| 4 | 🐰 Small Animals | 7M |
| 5 | 🐦 Bird | 6M |
| 6 | 🦎 Reptile | 6M |
| 7 | 🐴 Horse | 2M |
| 8 | 🐠 Saltwater Fish | 2M |
Note: Households can own multiple pets, and are counted for all relevant categories.
Cats rank second, at 47 million households, and these smaller felines are a little less expensive to own at $700/year according to Forbes estimates.
But aside from these two juggernauts, there are plenty of other common pet types found in households across the country.
Freshwater fish can be found in 11 million households, along with small animals—rabbits, hamsters, guinea pigs—in 7 million. Meanwhile, nearly 6 million homes have birds or reptiles.
Pet Ownership is on the Rise in America
Forbes found that 66% of all American households (numbering 87 million) own at least one pet, up from 56% in 1988. One third of these (29 million) own multiple pets.
A combination of factors is driving this increase: rising incomes, delayed childbirth, and of course the impact of the pandemic which nearly cleared out animal shelters across the globe.
America’s loneliness epidemic may also be a factor. Fledgling research has shown that single-individual households with pets recorded lower rates of loneliness during the pandemic than those without a pet.

-

 Science1 week ago
Visualizing the Average Lifespans of Mammals
-

 Markets2 weeks ago
The Top 10 States by Real GDP Growth in 2023
-

 Demographics2 weeks ago
The Smallest Gender Wage Gaps in OECD Countries
-

 United States2 weeks ago
Where U.S. Inflation Hit the Hardest in March 2024
-

 Green2 weeks ago
Top Countries By Forest Growth Since 2001
-

 United States2 weeks ago
Ranked: The Largest U.S. Corporations by Number of Employees
-

 Maps2 weeks ago
The Largest Earthquakes in the New York Area (1970-2024)
-

 Green2 weeks ago
Ranked: The Countries With the Most Air Pollution in 2023