Markets
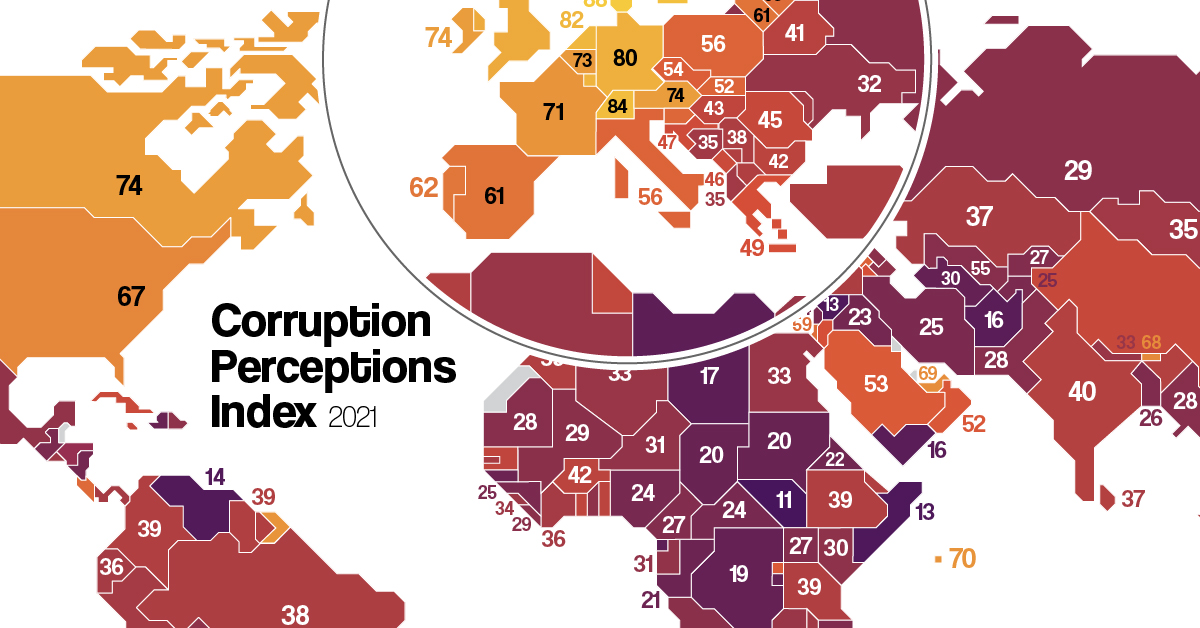
Mapped: Corruption in Countries Around the World
For more detail, view the full-sized version of this infographic
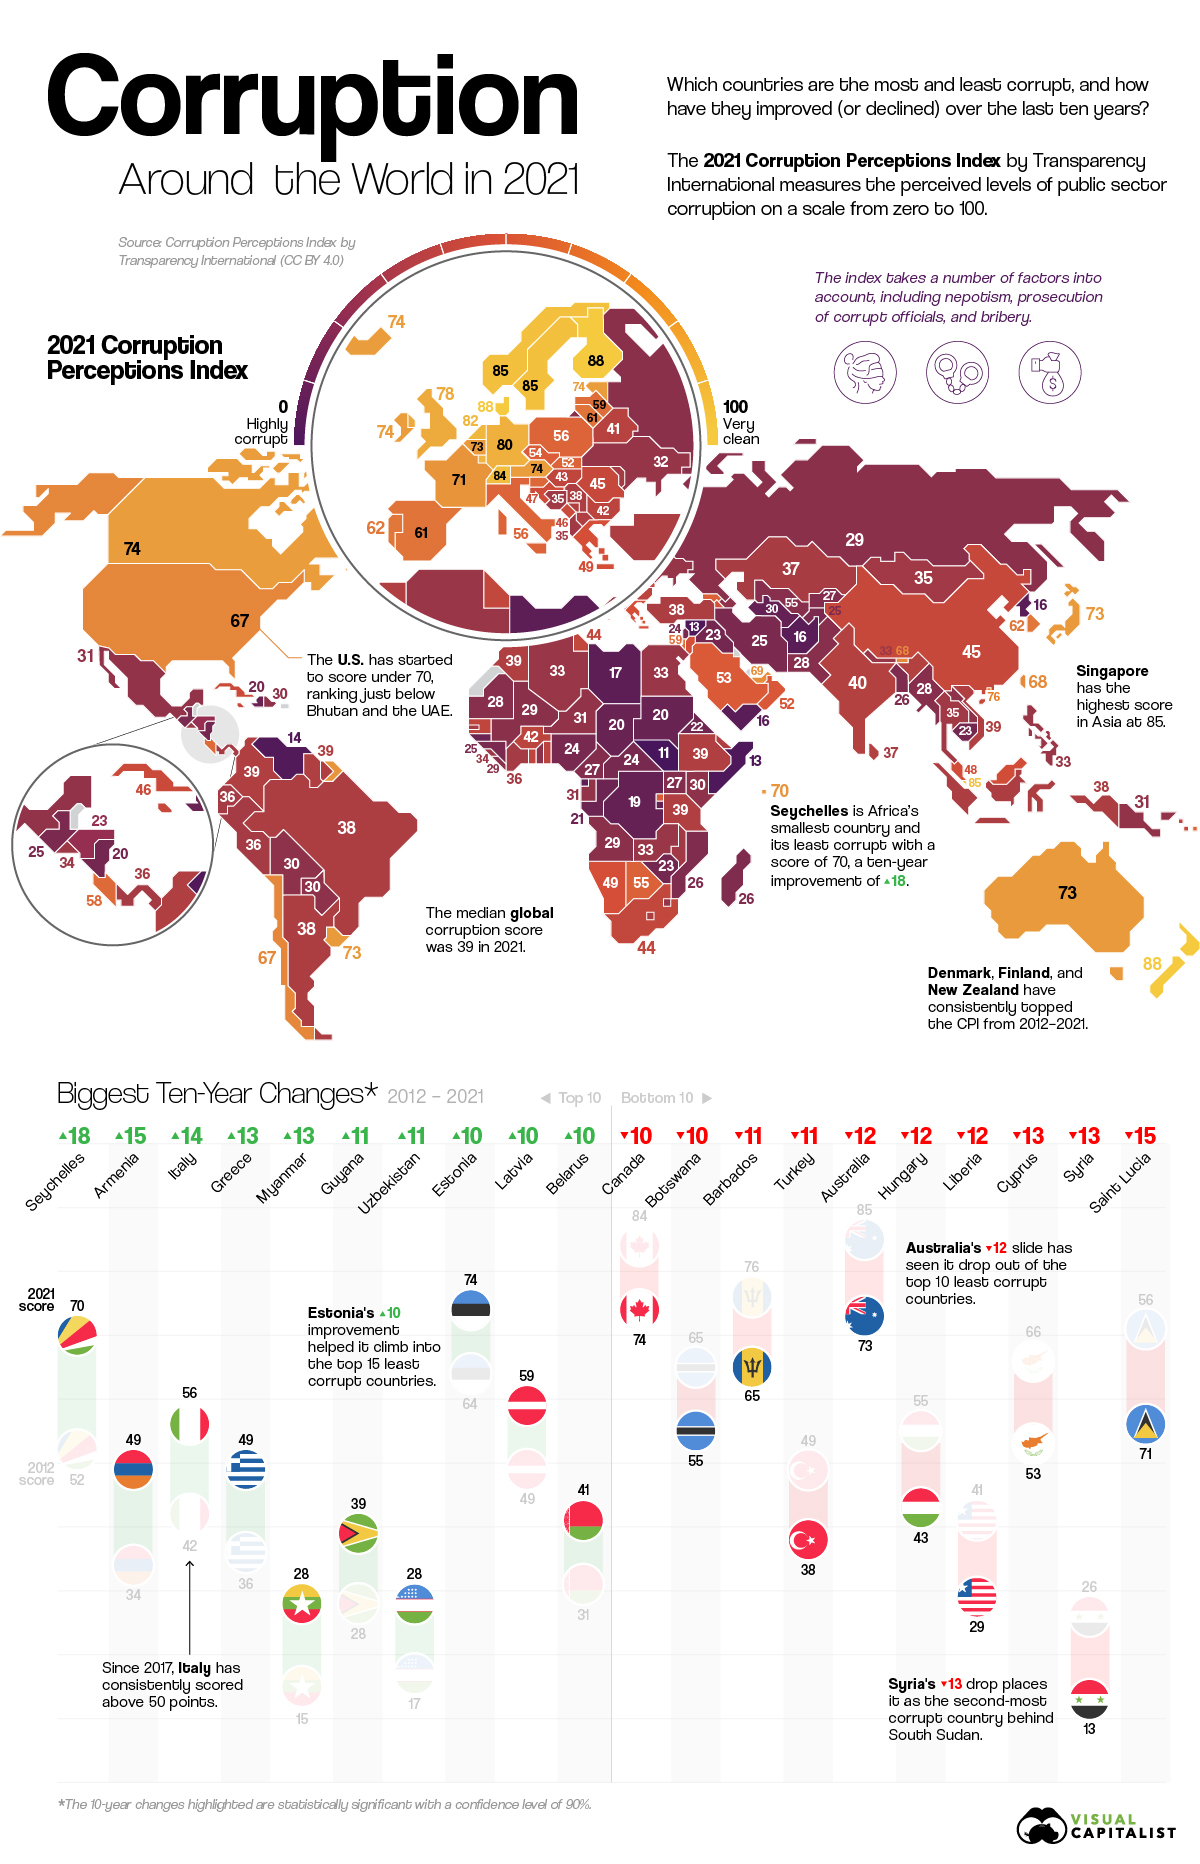


Mapped: Corruption in Countries Around the World
How bad is public sector corruption around the world, and how do different countries compare?
No matter your system of government, the public sector plays a vital role in establishing your economic mobility and political freedoms. Measuring corruption—the abuse of power for private gain—reveals how equal a system truly is.
For more than a decade, the Corruption Perceptions Index (CPI) by Transparency International has been the world’s most widely-used metric for scoring corruption. This infographic uses the 2021 CPI to visualize corruption in countries around the world, and the biggest 10-year changes.
Which Countries are Most (and Least) Corrupt?
How do you measure corruption, which includes behind-the-scenes deals, nepotism, corrupt prosecution, and bribery?
Over the last few decades, the CPI has found success doing so indirectly through perceptions.
By aggregating multiple analyses from country and business experts, the index assigns each country a score on a scale of 0 to 100, where 0 is highly corrupt and 100 is very clean.
Here are the results of the 2021 CPI, with the least corrupt countries at the top:
| Corruption Perception by Country | Score (2021) |
|---|---|
| Denmark | 88 |
| Finland | 88 |
| New Zealand | 88 |
| Norway | 85 |
| Singapore | 85 |
| Sweden | 85 |
| Switzerland | 84 |
| Netherlands | 82 |
| Luxembourg | 81 |
| Germany | 80 |
| UK | 78 |
| Hong Kong | 76 |
| Austria | 74 |
| Canada | 74 |
| Estonia | 74 |
| Iceland | 74 |
| Ireland | 74 |
| Australia | 73 |
| Belgium | 73 |
| Japan | 73 |
| Uruguay | 73 |
| France | 71 |
| Seychelles | 70 |
| UAE | 69 |
| Bhutan | 68 |
| Taiwan | 68 |
| Chile | 67 |
| U.S. | 67 |
| Barbados | 65 |
| Bahamas | 64 |
| Qatar | 63 |
| Portugal | 62 |
| South Korea | 62 |
| Lithuania | 61 |
| Spain | 61 |
| Israel | 59 |
| Latvia | 59 |
| Saint Vincent and the Grenadines | 59 |
| Cabo Verde | 58 |
| Costa Rica | 58 |
| Slovenia | 57 |
| Italy | 56 |
| Poland | 56 |
| Saint Lucia | 56 |
| Botswana | 55 |
| Dominica | 55 |
| Fiji | 55 |
| Georgia | 55 |
| Czechia | 54 |
| Malta | 54 |
| Mauritius | 54 |
| Cyprus | 53 |
| Grenada | 53 |
| Rwanda | 53 |
| Saudi Arabia | 53 |
| Oman | 52 |
| Slovakia | 52 |
| Armenia | 49 |
| Greece | 49 |
| Jordan | 49 |
| Namibia | 49 |
| Malaysia | 48 |
| Croatia | 47 |
| Cuba | 46 |
| Montenegro | 46 |
| China | 45 |
| Romania | 45 |
| Sao Tome and Principe | 45 |
| Vanuatu | 45 |
| Jamaica | 44 |
| South Africa | 44 |
| Tunisia | 44 |
| Ghana | 43 |
| Hungary | 43 |
| Kuwait | 43 |
| Senegal | 43 |
| Solomon Islands | 43 |
| Bahrain | 42 |
| Benin | 42 |
| Bulgaria | 42 |
| Burkina Faso | 42 |
| Belarus | 41 |
| Timor-Leste | 41 |
| Trinidad and Tobago | 41 |
| India | 40 |
| Maldives | 40 |
| Colombia | 39 |
| Ethiopia | 39 |
| Guyana | 39 |
| Kosovo | 39 |
| Morocco | 39 |
| North Macedonia | 39 |
| Suriname | 39 |
| Tanzania | 39 |
| Vietnam | 39 |
| Argentina | 38 |
| Brazil | 38 |
| Indonesia | 38 |
| Lesotho | 38 |
| Serbia | 38 |
| Turkey | 38 |
| Gambia | 37 |
| Kazakhstan | 37 |
| Sri Lanka | 37 |
| Cote d'Ivoire | 36 |
| Ecuador | 36 |
| Moldova | 36 |
| Panama | 36 |
| Peru | 36 |
| Albania | 35 |
| Bosnia and Herzegovina | 35 |
| Malawi | 35 |
| Mongolia | 35 |
| Thailand | 35 |
| El Salvador | 34 |
| Sierra Leone | 34 |
| Algeria | 33 |
| Egypt | 33 |
| Nepal | 33 |
| Philippines | 33 |
| Zambia | 33 |
| Eswatini | 32 |
| Ukraine | 32 |
| Gabon | 31 |
| Mexico | 31 |
| Niger | 31 |
| Papua New Guinea | 31 |
| Azerbaijan | 30 |
| Bolivia | 30 |
| Djibouti | 30 |
| Dominican Republic | 30 |
| Kenya | 30 |
| Laos | 30 |
| Paraguay | 30 |
| Togo | 30 |
| Angola | 29 |
| Liberia | 29 |
| Mali | 29 |
| Russia | 29 |
| Mauritania | 28 |
| Myanmar | 28 |
| Pakistan | 28 |
| Uzbekistan | 28 |
| Cameroon | 27 |
| Kyrgyzstan | 27 |
| Uganda | 27 |
| Bangladesh | 26 |
| Madagascar | 26 |
| Mozambique | 26 |
| Guatemala | 25 |
| Guinea | 25 |
| Iran | 25 |
| Tajikistan | 25 |
| Central African Republic | 24 |
| Lebanon | 24 |
| Nigeria | 24 |
| Cambodia | 23 |
| Honduras | 23 |
| Iraq | 23 |
| Zimbabwe | 23 |
| Eritrea | 22 |
| Congo | 21 |
| Guinea-Bissau | 21 |
| Chad | 20 |
| Comoros | 20 |
| Haiti | 20 |
| Nicaragua | 20 |
| Sudan | 20 |
| Burundi | 19 |
| Democratic Republic of the Congo | 19 |
| Turkmenistan | 19 |
| Equatorial Guinea | 17 |
| Libya | 17 |
| Afghanistan | 16 |
| North Korea | 16 |
| Yemen | 16 |
| Venezuela | 14 |
| Somalia | 13 |
| Syria | 13 |
| South Sudan | 11 |
Ranking at the top of the index with scores of 88 are Nordic countries Denmark and Finland, as well as New Zealand.
They’ve consistently topped the CPI over the last decade, and Europe in general had 14 of the top 20 least corrupt countries. Asia also had many notable entrants, including Singapore (tied for #4), Hong Kong (#12), and Japan (tied for #18).
Comparatively, the Americas only had two countries score in the top 20 least corrupt: Canada (tied for #13) and Uruguay (tied for #18). With a score of 67, the U.S. scored at #28 just behind Bhutan, the UAE, and France.
Scoring towards the bottom of the index were many countries currently and historically going through conflict, primarily located in the Middle East and Africa. They include Afghanistan, Venezuela, Somalia, and South Sudan. The latter country finishes at the very bottom of the list, with a score of just 11.
How Corruption in Countries Has Changed (2012–2021)
Corruption is a constant and moving global problem, so it’s also important to measure which countries have had their images improved (or worsened).
By using CPI scores dating back to 2012, we can examine how country scores have changed over the last decade:
| Change in Corruption by Country | 10-Year Trend (2012-2021) |
|---|---|
| Seychelles | +18 |
| Armenia | +15 |
| Italy | +14 |
| Greece | +13 |
| Myanmar | +13 |
| Guyana | +11 |
| Uzbekistan | +11 |
| Estonia | +10 |
| Latvia | +10 |
| Belarus | +10 |
| Saudi Arabia | +9 |
| Kazakhstan | +9 |
| Laos | +9 |
| Timor-Leste | +8 |
| Vietnam | +8 |
| Afghanistan | +8 |
| North Korea | +8 |
| Taiwan | +7 |
| Lithuania | +7 |
| Senegal | +7 |
| Cote d'Ivoire | +7 |
| Angola | +7 |
| Sudan | +7 |
| South Korea | +6 |
| Slovakia | +6 |
| China | +6 |
| Jamaica | +6 |
| Benin | +6 |
| Ethiopia | +6 |
| Indonesia | +6 |
| Nepal | +6 |
| Ukraine | +6 |
| Papua New Guinea | +6 |
| Austria | +5 |
| Ireland | +5 |
| Bhutan | +5 |
| Czechia | +5 |
| Oman | +5 |
| Montenegro | +5 |
| Kosovo | +5 |
| Paraguay | +5 |
| Iraq | +5 |
| Somalia | +5 |
| United Kingdom | +4 |
| Costa Rica | +4 |
| Burkina Faso | +4 |
| India | +4 |
| Tanzania | +4 |
| Ecuador | +4 |
| Georgia | +3 |
| Sao Tome and Principe | +3 |
| Tunisia | +3 |
| Colombia | +3 |
| Argentina | +3 |
| Gambia | +3 |
| Sierra Leone | +3 |
| Azerbaijan | +3 |
| Kenya | +3 |
| Kyrgyzstan | +3 |
| Tajikistan | +3 |
| Zimbabwe | +3 |
| Trinidad and Tobago | +2 |
| Morocco | +2 |
| Suriname | +2 |
| Albania | +2 |
| Turkmenistan | +2 |
| Luxembourg | +1 |
| Germany | +1 |
| Uruguay | +1 |
| United Arab Emirates | +1 |
| Jordan | +1 |
| Namibia | +1 |
| Croatia | +1 |
| Romania | +1 |
| South Africa | +1 |
| Bulgaria | +1 |
| Egypt | +1 |
| Russia | +1 |
| Pakistan | +1 |
| Cameroon | +1 |
| Guinea | +1 |
| Cambodia | +1 |
| Haiti | +1 |
| Chad | +1 |
| Norway | 0 |
| France | 0 |
| Rwanda | 0 |
| Moldova | 0 |
| Togo | 0 |
| Bangladesh | 0 |
| Burundi | 0 |
| Hong Kong | -1 |
| Japan | -1 |
| Portugal | -1 |
| Israel | -1 |
| Malaysia | -1 |
| Kuwait | -1 |
| Serbia | -1 |
| Mongolia | -1 |
| Algeria | -1 |
| Philippines | -1 |
| Denmark | -2 |
| Finland | -2 |
| New Zealand | -2 |
| Singapore | -2 |
| Switzerland | -2 |
| Netherlands | -2 |
| Belgium | -2 |
| Cabo Verde | -2 |
| Poland | -2 |
| Cuba | -2 |
| Ghana | -2 |
| Panama | -2 |
| Peru | -2 |
| Malawi | -2 |
| Thailand | -2 |
| Niger | -2 |
| Dominican Republic | -2 |
| Uganda | -2 |
| Central African Republic | -2 |
| Democratic Republic of the Congo | -2 |
| Sweden | -3 |
| Saint Vincent and the Grenadines | -3 |
| Dominica | -3 |
| Malta | -3 |
| Mauritius | -3 |
| Sri Lanka | -3 |
| Mexico | -3 |
| Mauritania | -3 |
| Iran | -3 |
| Nigeria | -3 |
| Eritrea | -3 |
| Equatorial Guinea | -3 |
| Spain | -4 |
| Slovenia | -4 |
| North Macedonia | -4 |
| El Salvador | -4 |
| Zambia | -4 |
| Gabon | -4 |
| Bolivia | -4 |
| Guinea-Bissau | -4 |
| Libya | -4 |
| Chile | -5 |
| Qatar | -5 |
| Brazil | -5 |
| Eswatini | -5 |
| Mali | -5 |
| Mozambique | -5 |
| Honduras | -5 |
| Congo | -5 |
| Venezuela | -5 |
| United States of America | -6 |
| Djibouti | -6 |
| Madagascar | -6 |
| Lebanon | -6 |
| Bahamas | -7 |
| Lesotho | -7 |
| Bosnia and Herzegovina | -7 |
| Yemen | -7 |
| Iceland | -8 |
| Guatemala | -8 |
| Comoros | -8 |
| Bahrain | -9 |
| Nicaragua | -9 |
| Canada | -10 |
| Botswana | -10 |
| Barbados | -11 |
| Turkey | -11 |
| Australia | -12 |
| Hungary | -12 |
| Liberia | -12 |
| Cyprus | -13 |
| Syria | -13 |
| Saint Lucia | -15 |
| Fiji | N/A |
| Grenada | N/A |
| Vanuatu | N/A |
| Solomon Islands | N/A |
| Maldives | N/A |
| South Sudan | N/A |
The biggest climber with +18 was Seychelles, Africa’s smallest country and also its least corrupt with a score of 70. Other notable improvements include neighboring countries Estonia, Latvia, and Belarus, with Estonia rising into the top 15 least corrupt countries.
On the opposite side, both Australia (-12) and Canada (-10) have actually fallen out of the top 10 least corrupt countries over the last decade. They’re joined by decreases in Hungary (-12) and Syria (-13), which is now ranked as the world’s second-most corrupt country.
Which countries will rise and fall in corruption perceptions over the next 10 years, and how do your perceptions compare with this list?


Markets
Visualizing Global Inflation Forecasts (2024-2026)
Here are IMF forecasts for global inflation rates up to 2026, highlighting a slow descent of price pressures amid resilient global growth.


Visualizing Global Inflation Forecasts (2024-2026)
Global inflation rates are gradually descending, but progress has been slow.
Today, the big question is if inflation will decline far enough to trigger easing monetary policy. So far, the Federal Reserve has held rates for nine months amid stronger than expected core inflation, which excludes volatile energy and food prices.
Yet looking further ahead, inflation forecasts from the International Monetary Fund (IMF) suggest that inflation will decline as price pressures ease, but the path of disinflation is not without its unknown risks.
This graphic shows global inflation forecasts, based on data from the April 2024 IMF World Economic Outlook.
Get the Key Insights of the IMF’s World Economic Outlook
Want a visual breakdown of the insights from the IMF’s 2024 World Economic Outlook report?
This visual is part of a special dispatch of the key takeaways exclusively for VC+ members.
Get the full dispatch of charts by signing up to VC+.
The IMF’s Inflation Outlook
Below, we show the IMF’s latest projections for global inflation rates through to 2026:
| Year | Global Inflation Rate (%) | Advanced Economies Inflation Rate (%) | Emerging Market and Developing Economies Inflation Rate (%) |
|---|---|---|---|
| 2019 | 3.5 | 1.4 | 5.1 |
| 2020 | 3.2 | 0.7 | 5.2 |
| 2021 | 4.7 | 3.1 | 5.9 |
| 2022 | 8.7 | 7.3 | 9.8 |
| 2023 | 6.8 | 4.6 | 8.3 |
| 2024 | 5.9 | 2.6 | 8.3 |
| 2025 | 4.5 | 2.0 | 6.2 |
| 2026 | 3.7 | 2.0 | 4.9 |
After hitting a peak of 8.7% in 2022, global inflation is projected to fall to 5.9% in 2024, reflecting promising inflation trends amid resilient global growth.
While inflation has largely declined due to falling energy and goods prices, persistently high services inflation poses challenges to mitigating price pressures. In addition, the IMF highlights the potential risk of an escalating conflict in the Middle East, which could lead to energy price shocks and higher shipping costs.
These developments could negatively affect inflation scenarios and prompt central banks to adopt tighter monetary policies. Overall, by 2026, global inflation is anticipated to decline to 3.7%—still notably above the 2% target set by several major economies.
Adding to this, we can see divergences in the path of inflation between advanced and emerging economies. While affluent nations are forecast to see inflation edge closer to the 2% target by 2026, emerging economies are projected to have inflation rates reach 4.9%—falling closer to their pre-pandemic averages.
Get the Full Analysis of the IMF’s Outlook on VC+
This visual is part of an exclusive special dispatch for VC+ members which breaks down the key takeaways from the IMF’s 2024 World Economic Outlook.
For the full set of charts and analysis, sign up for VC+.

-

 Culture6 days ago
The World’s Top Media Franchises by All-Time Revenue
-

 Science2 weeks ago
Visualizing the Average Lifespans of Mammals
-

 Brands2 weeks ago
How Tech Logos Have Evolved Over Time
-

 Energy2 weeks ago
Ranked: The Top 10 EV Battery Manufacturers in 2023
-

 Countries2 weeks ago
Countries With the Largest Happiness Gains Since 2010
-

 Economy2 weeks ago
VC+: Get Our Key Takeaways From the IMF’s World Economic Outlook
-

 Demographics2 weeks ago
The Countries That Have Become Sadder Since 2010
-

 Money1 week ago
Charted: Who Has Savings in This Economy?