Money
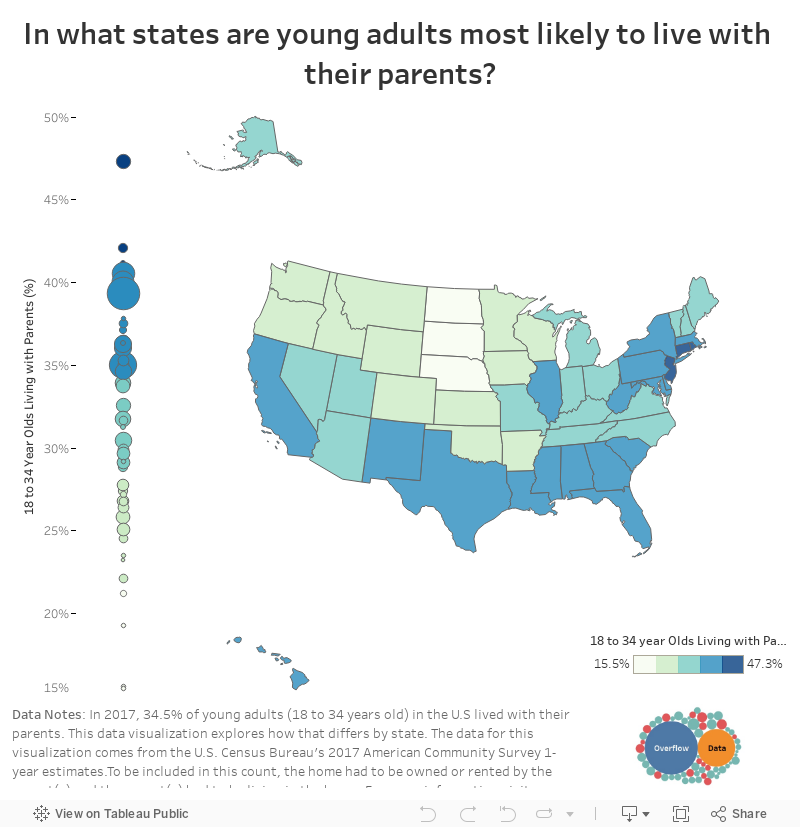
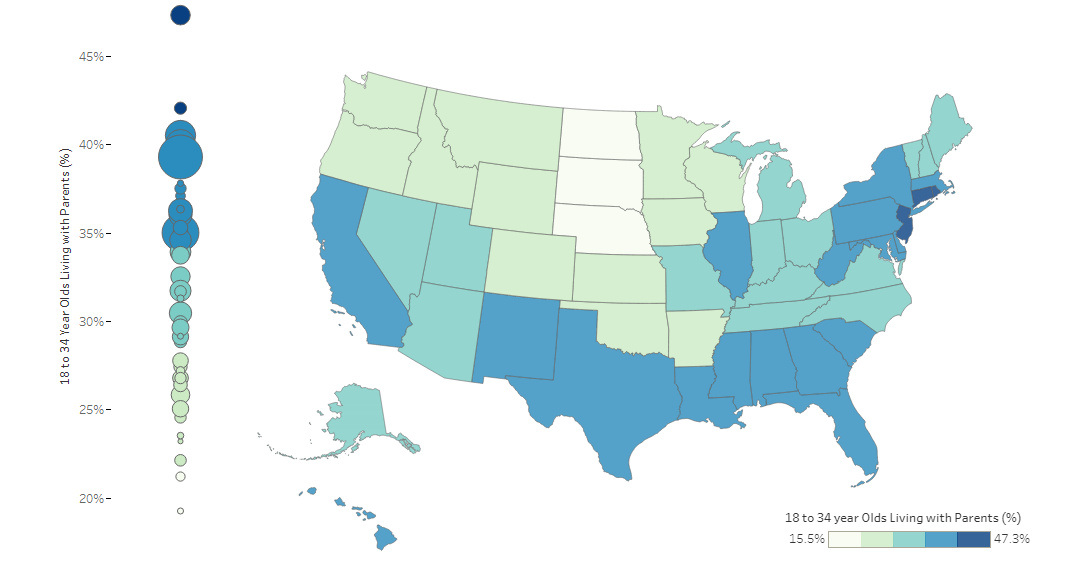
Map: Where Young Adults Live With Their Parents in the U.S.
var divElement = document.getElementById(‘viz1546499151607’); var vizElement = divElement.getElementsByTagName(‘object’)[0]; if ( divElement.offsetWidth > 800 ) { vizElement.style.width=’1000px’;vizElement.style.height=’827px’;} else if ( divElement.offsetWidth > 500 ) { vizElement.style.width=’100%’;vizElement.style.height=’827px’;} else { vizElement.style.width=’100%’;vizElement.style.height=’1027px’;} var scriptElement = document.createElement(‘script’); scriptElement.src = ‘https://public.tableau.com/javascripts/api/viz_v1.js’; vizElement.parentNode.insertBefore(scriptElement, vizElement);
Map: Where Young Adults Live With Their Parents in the U.S.
For a variety of different reasons, there is a growing proportion of young adults that are living with their parents in the United States.
As of 2017, it’s estimated that 34.5% of young adults (18-34 years old) in the U.S live at home – one of the highest percentages in recent memory. How does this national average compare to individual states, and how does data break down further by age and gender over time?
Living at Home
Today’s interactive map comes to us from Overflow Data, and visualizes data at the state level, showing a wide range from 16% (D.C., North Dakota) to closer to 47% (New Jersey).
Here are the five states with the highest proportion of young adults living at home:
| Rank | State | Population (Young Adults) | % Living at Home |
|---|---|---|---|
| #1 | New Jersey | 1.9 million | 47.3% |
| #2 | Connecticut | 0.7 million | 42.0% |
| #3 | New York | 4.5 million | 40.5% |
| #4 | Florida | 4.3 million | 40.0% |
| #5 | California | 9.4 million | 39.3% |
New Jersey is the surprising leader here, with 47.3% of young adults between 18-34 years living at home. This is at least partially a result of the state’s proximity to big cities like New York City and Philadelphia, in which young adults choose to commute instead of renting or buying places in those cities themselves.
With higher housing costs and rents, it’s also not surprising to see other states with large populations like California, Florida, and New York as being well represented at the top of the list.
Differences by Age
While figures are going up across the board, a particular subsegment (25-34 years old) stands out as rising to its highest point in at least 30 years.
Both men and women in this older millennial segment are starting to become more likely to stay at home:
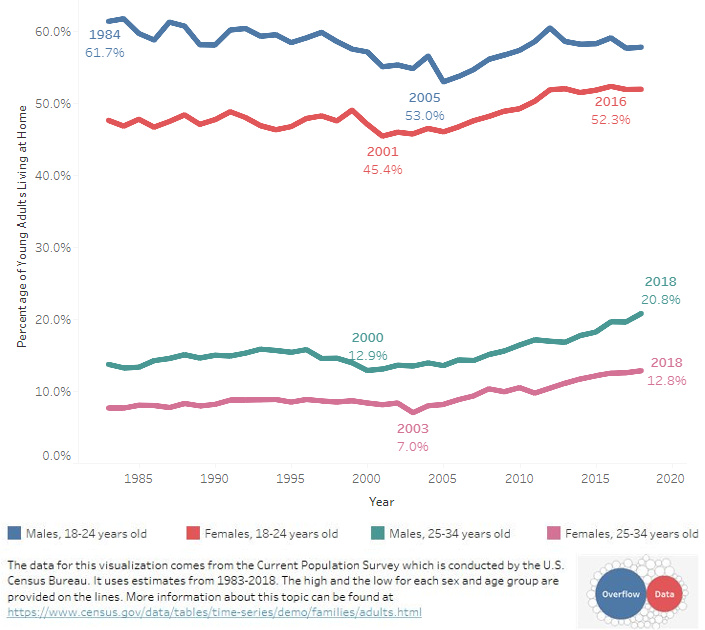
There are many potential culprits for this trend, including social and economic factors.
It’s well-documented that millennials are marrying later, which is a traditional impetus for moving away from home. Today’s young adults are also putting off having kids until later in adulthood.
At the same time, on the economic front, higher housing prices and mounting student debt are two factors that are preventing young adults from having the necessary resources to move out as early as they might like.
What do you think is the major cause behind this trend, and do you think it will reverse?


Money
Charted: Which City Has the Most Billionaires in 2024?
Just two countries account for half of the top 20 cities with the most billionaires. And the majority of the other half are found in Asia.


Charted: Which Country Has the Most Billionaires in 2024?
This was originally posted on our Voronoi app. Download the app for free on iOS or Android and discover incredible data-driven charts from a variety of trusted sources.
Some cities seem to attract the rich. Take New York City for example, which has 340,000 high-net-worth residents with investable assets of more than $1 million.
But there’s a vast difference between being a millionaire and a billionaire. So where do the richest of them all live?
Using data from the Hurun Global Rich List 2024, we rank the top 20 cities with the highest number of billionaires in 2024.
A caveat to these rich lists: sources often vary on figures and exact rankings. For example, in last year’s reports, Forbes had New York as the city with the most billionaires, while the Hurun Global Rich List placed Beijing at the top spot.
Ranked: Top 20 Cities with the Most Billionaires in 2024
The Chinese economy’s doldrums over the course of the past year have affected its ultra-wealthy residents in key cities.
Beijing, the city with the most billionaires in 2023, has not only ceded its spot to New York, but has dropped to #4, overtaken by London and Mumbai.
| Rank | City | Billionaires | Rank Change YoY |
|---|---|---|---|
| 1 | 🇺🇸 New York | 119 | +1 |
| 2 | 🇬🇧 London | 97 | +3 |
| 3 | 🇮🇳 Mumbai | 92 | +4 |
| 4 | 🇨🇳 Beijing | 91 | -3 |
| 5 | 🇨🇳 Shanghai | 87 | -2 |
| 6 | 🇨🇳 Shenzhen | 84 | -2 |
| 7 | 🇭🇰 Hong Kong | 65 | -1 |
| 8 | 🇷🇺 Moscow | 59 | No Change |
| 9 | 🇮🇳 New Delhi | 57 | +6 |
| 10 | 🇺🇸 San Francisco | 52 | No Change |
| 11 | 🇹🇭 Bangkok | 49 | +2 |
| 12 | 🇹🇼 Taipei | 45 | +2 |
| 13 | 🇫🇷 Paris | 44 | -2 |
| 14 | 🇨🇳 Hangzhou | 43 | -5 |
| 15 | 🇸🇬 Singapore | 42 | New to Top 20 |
| 16 | 🇨🇳 Guangzhou | 39 | -4 |
| 17T | 🇮🇩 Jakarta | 37 | +1 |
| 17T | 🇧🇷 Sao Paulo | 37 | No Change |
| 19T | 🇺🇸 Los Angeles | 31 | No Change |
| 19T | 🇰🇷 Seoul | 31 | -3 |
In fact all Chinese cities on the top 20 list have lost billionaires between 2023–24. Consequently, they’ve all lost ranking spots as well, with Hangzhou seeing the biggest slide (-5) in the top 20.
Where China lost, all other Asian cities—except Seoul—in the top 20 have gained ranks. Indian cities lead the way, with New Delhi (+6) and Mumbai (+3) having climbed the most.
At a country level, China and the U.S combine to make up half of the cities in the top 20. They are also home to about half of the world’s 3,200 billionaire population.
In other news of note: Hurun officially counts Taylor Swift as a billionaire, estimating her net worth at $1.2 billion.

-

 Debt1 week ago
How Debt-to-GDP Ratios Have Changed Since 2000
-

 Markets2 weeks ago
Ranked: The World’s Top Flight Routes, by Revenue
-

 Countries2 weeks ago
Population Projections: The World’s 6 Largest Countries in 2075
-

 Markets2 weeks ago
The Top 10 States by Real GDP Growth in 2023
-

 Demographics2 weeks ago
The Smallest Gender Wage Gaps in OECD Countries
-

 United States2 weeks ago
Where U.S. Inflation Hit the Hardest in March 2024
-

 Green2 weeks ago
Top Countries By Forest Growth Since 2001
-

 United States2 weeks ago
Ranked: The Largest U.S. Corporations by Number of Employees