Entrepreneurship
How Leadership Accountability Drives Company Performance
Leadership plays a big role in determining the success of an organization.
Effective and accountable leadership can help propel a company forward. On the flip side, a failure to live up to the expectations of leadership can have cascading and lingering effects across an entire organization.
Bridging the Leadership Accountability Gap
Today’s infographic, from bestselling author Vince Molinaro, is a revealing look at the impact that leadership accountability can have on an organization.

Pre-order Vince Molinaro’s new book, Accountable Leaders
The Value of Leadership Accountability
The majority of people within organizations understand the value of leadership accountability – yet, in practice, many leaders fail to deliver on that promise.
A global survey of over 2,000 HR leaders and senior executives revealed that a mere 27% believed they had a strong leadership culture. Two-thirds of those surveyed believed that leadership accountability is a critical issue within their organization, while only one-third are satisfied with the degree of leadership accountability demonstrated at in their workplace.
What impact does this leadership accountability gap have on the performance of a company? As it turns out, a lot.
The Critical Link Between Accountability and Performance
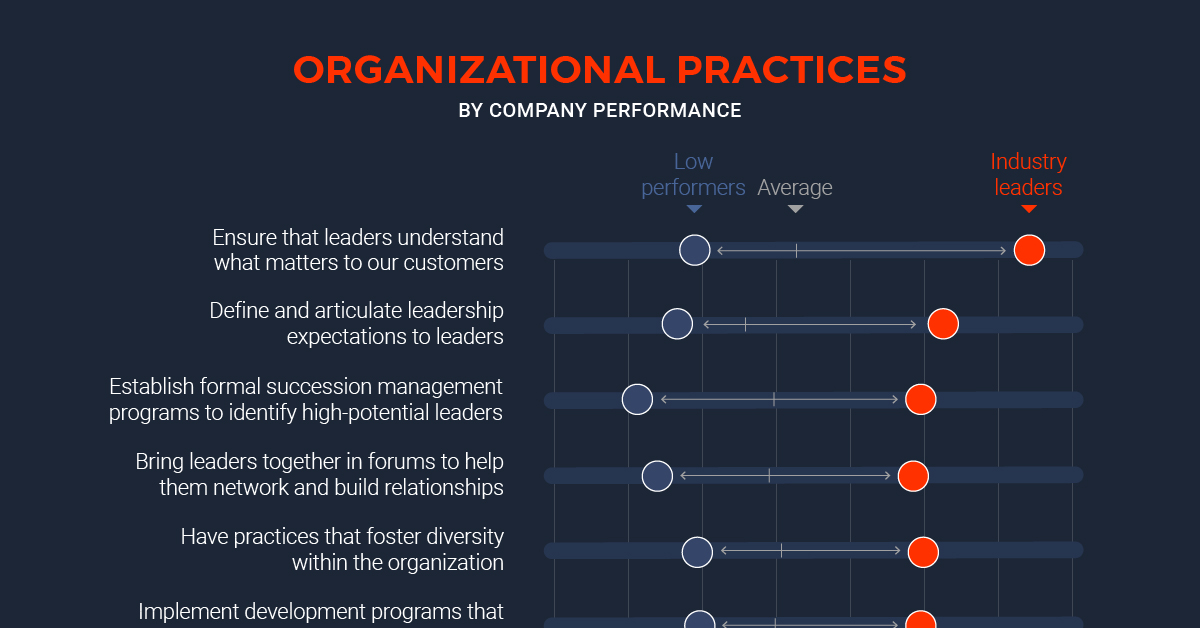
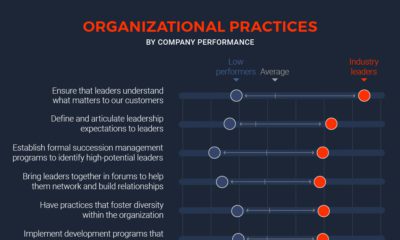
Once survey responses were organized into three distinct categories – low performers, average performers, and industry leaders – interesting trends began to emerge.
Companies in the “industry leaders” category were far more likely to have a culture of leadership accountability. In fact, industry leaders were twice as likely to have clearly established expectations for their leadership team than respondents in the average or lower performing categories. These high performing companies were also far more likely to:
- Have formal succession programs to help identify high-potential leaders
- Have practices in place to foster more diverse leadership teams
- Implement development programs to effectively build the capacity of leaders
Industry leading companies had leadership teams that ranked higher in a number of key areas. Leaders at high performing companies were far more likely to:
- Understand customer needs and desires
- Understand external trends affecting the business
- Demonstrate a high level of emotional maturity
- Demonstrate passion for executing on the company’s vision
In many of these areas, the gap between industry leaders and the other categories is significant, which presents a compelling case for embracing leadership accountability as a core value.
Building a Strong Leadership Culture: Questions to Ask
The first step to building a culture of leadership accountability is self reflection. Here are questions leaders can ask to help assess how their organization is doing:
- Is leadership accountability a critical priority in your organization?
- Has your organization set clear leadership expectations for leaders?
- Do you believe your leaders at all levels, are fully committed to their leadership roles?
- Have you built a strong and aligned leadership culture across your organization?
- Does your organization have the courage to identify and address mediocre leadership at an individual and team level?
Answering “no” to any of the questions above means there’s an opportunity to develop a more accountable and effective leadership team.
Only three things happen naturally in organizations. Friction, confusion and underperformance. Everything else requires leadership.
– Peter Drucker


Markets
Why Do People Start Businesses in Every U.S. State?
Is it for greater flexibility, more income, or something else? These graphics answer the question, why do people start businesses?
 Creator Program
Why Do People Start Businesses in Every U.S. State?
People have various motivations for starting their businesses.
Some seek higher income. Others are looking for a balance between family life and career. In some situations, entrepreneurship may be the only way to fight unemployment.
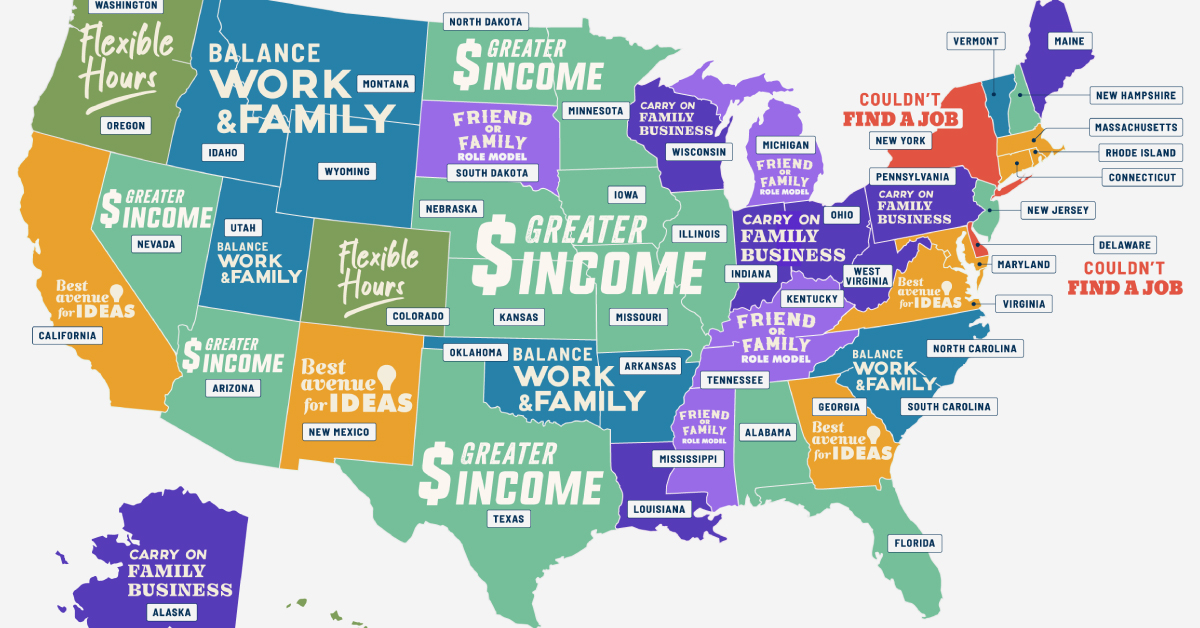
In this infographic, OnDeck uses data from the U.S. Census Bureau’s 2020 Annual Business Survey to highlight the most unique reasons for why people start businesses in each U.S. state.
Editor’s note: The map tracks the most popular unique reasons to start a business. In this case, “unique” is defined by how much a particular reason stands out from the U.S. average across all states. For example, in Delaware, more respondents said they started businesses because they “couldn’t find jobs” (11.6%) than in any other state (U.S. average: 7.3%). So, even though it’s not numerically the most popular reason overall, it is the unique reason that stands out the most for that state.
The Most Popular Unique Reasons to Start a Business
According to the Global Entrepreneurship Monitor, entrepreneurship rates in the U.S. have been trending upward over the past two decades.
In fact, despite multi-billion dollar companies getting the spotlight, 99.9% of businesses across the U.S. are small businesses, employing over 60 million people.
Wanting to make more income is the biggest unique factor in starting a business in 14 states, including some of the states with the highest unemployment rates, like New Hampshire, North Dakota, and Alabama.
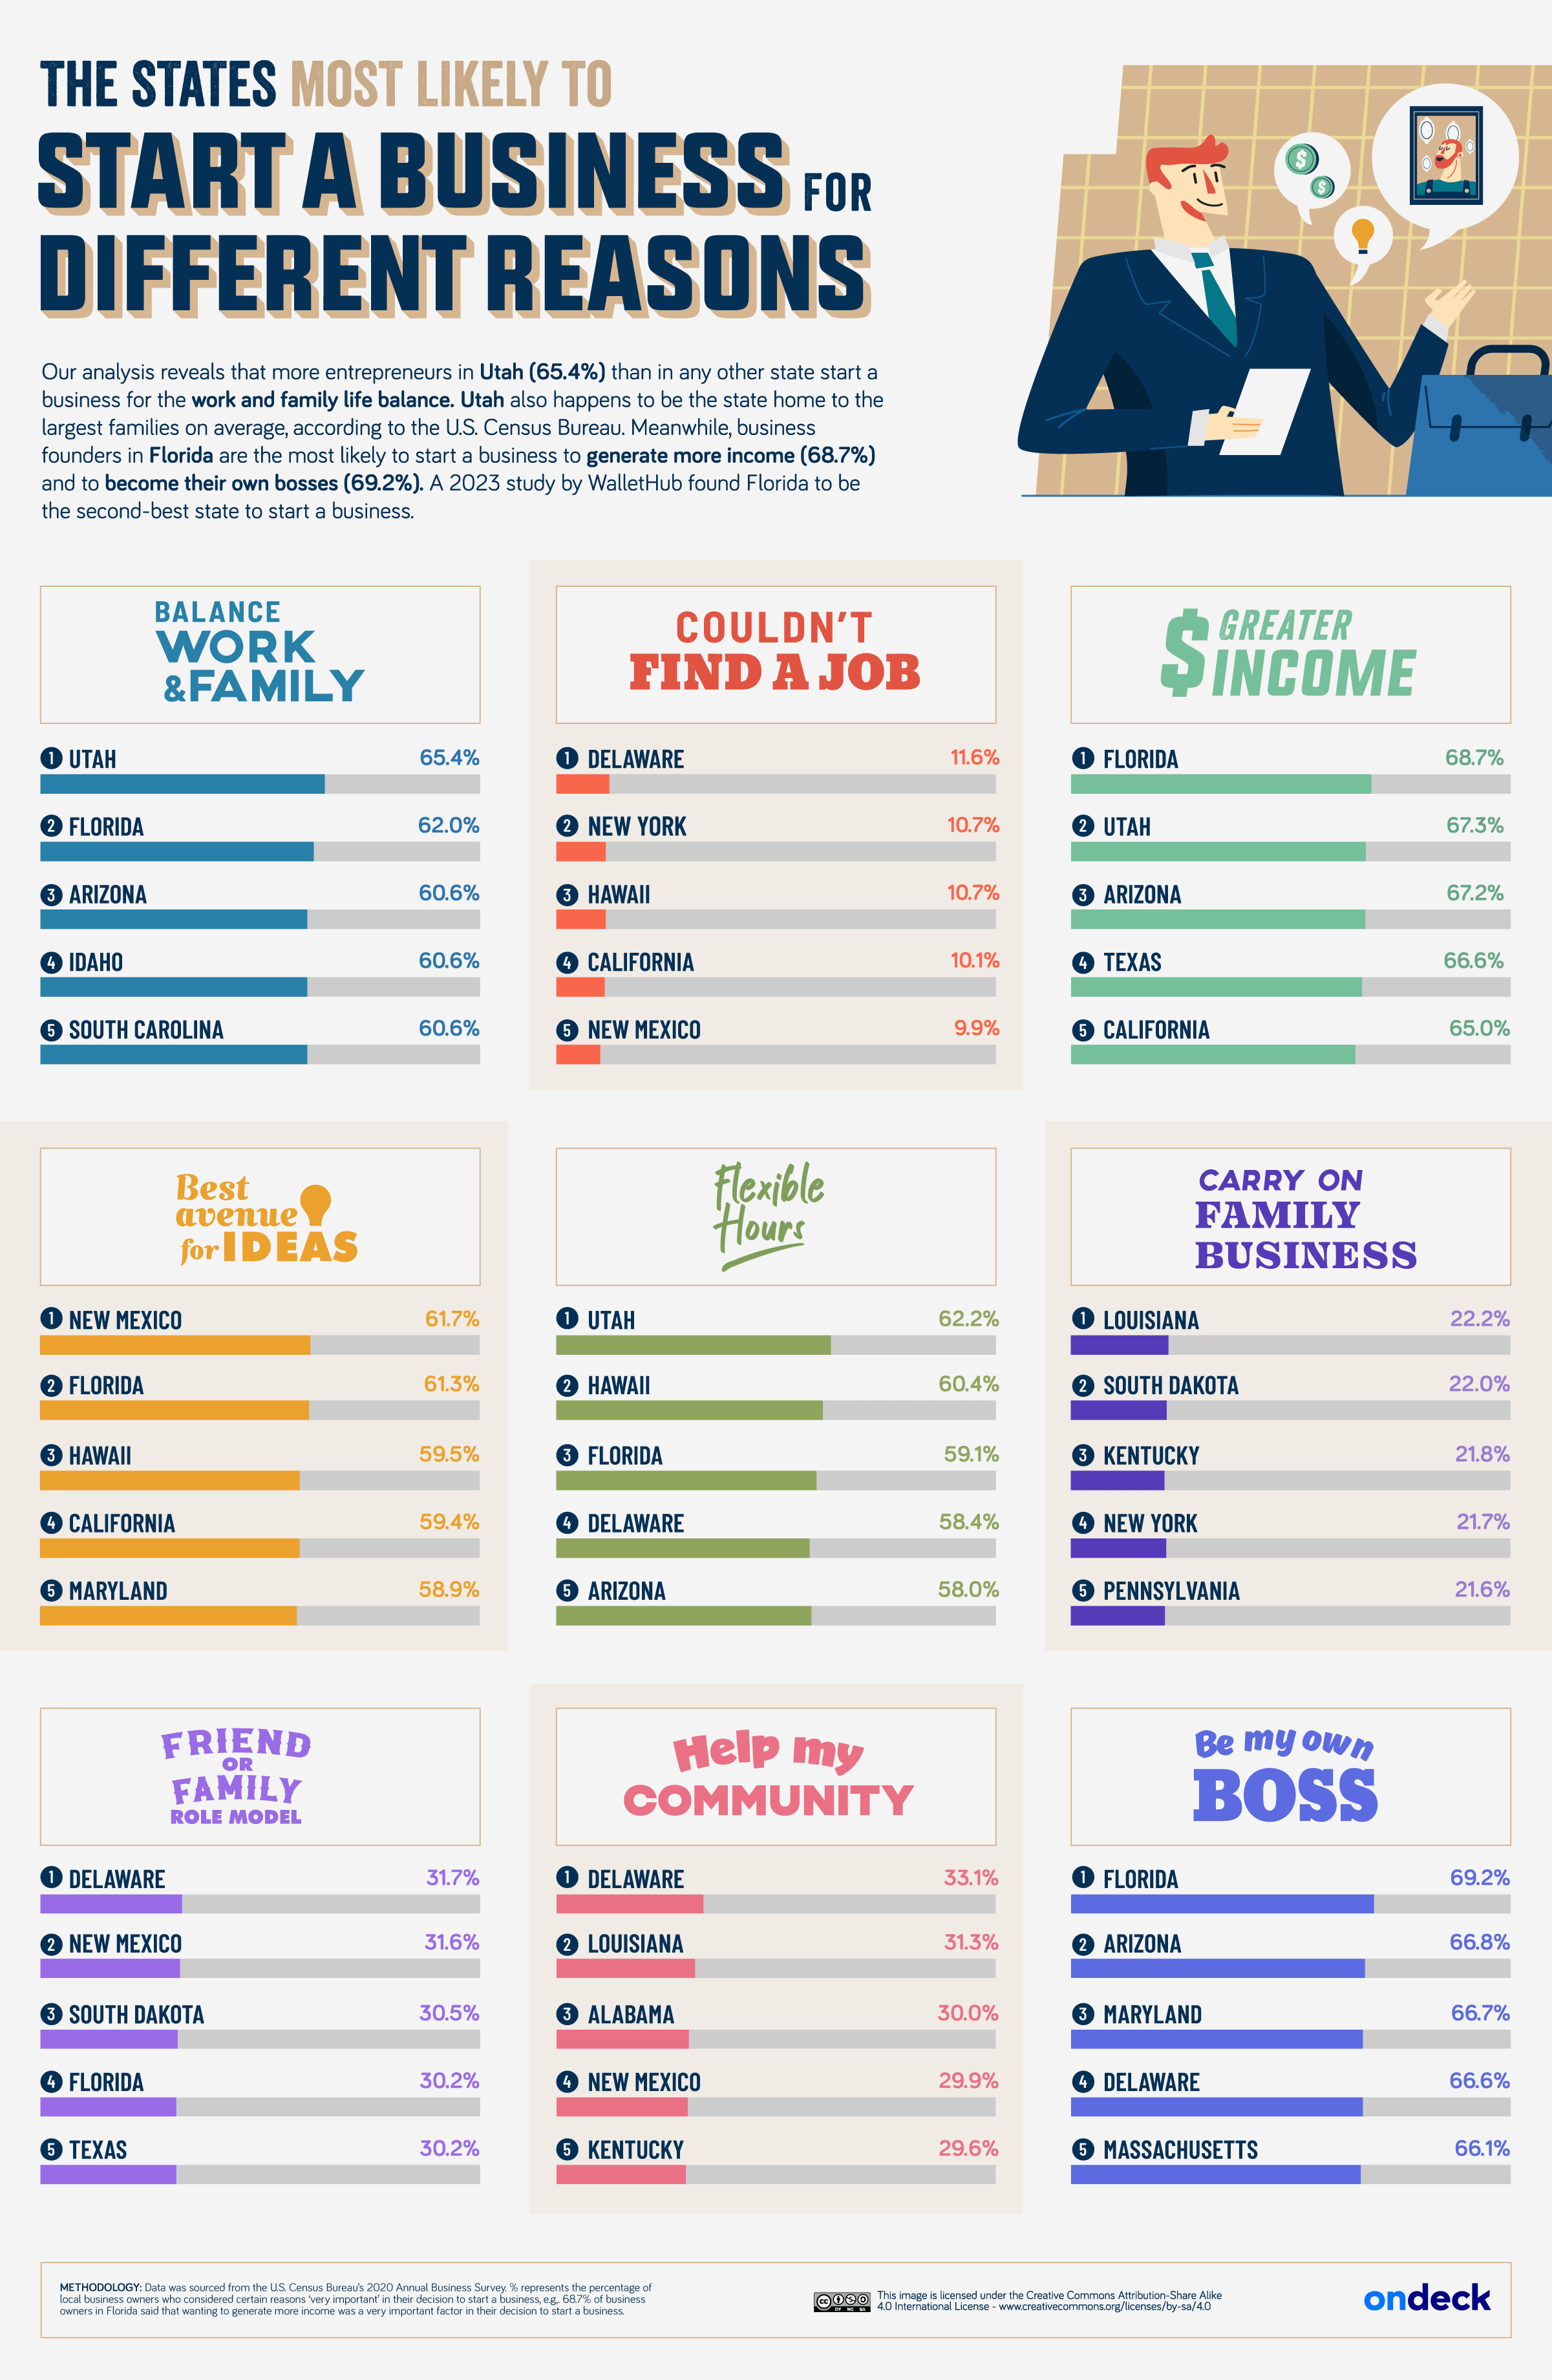
In Utah, a higher percentage (65.4%) of entrepreneurs start businesses to achieve a work-life balance than in any other state. Notably, Utah is known for having the largest average family size, as reported by the U.S. Census Bureau, and has a strong religious presence.
On the other hand, in Florida, more business founders (69.2%) start their businesses to become their own bosses than anywhere else.
New York and California are states where entrepreneurs mentioned that they couldn’t find a job as a key unique reason to start a business. In fact, both states lead as the worst for job seekers, as shown in another Visual Capitalist graphic.
Small Businesses to Remain Vital
Despite all the different reasons to start a business, the fact is that entrepreneurship is still crucial for the U.S. economy.
Over the last 25 years, small businesses have added over 12.9 million jobs. For perspective, that’s about two-thirds of the jobs added to the economy.
In 2021, a record-breaking 5.4 million new business applications were filed in the U.S.

-

 Wealth6 days ago
Charted: Which City Has the Most Billionaires in 2024?
-

 Mining2 weeks ago
Gold vs. S&P 500: Which Has Grown More Over Five Years?
-

 Uranium2 weeks ago
The World’s Biggest Nuclear Energy Producers
-

 Education2 weeks ago
How Hard Is It to Get Into an Ivy League School?
-

 Debt2 weeks ago
How Debt-to-GDP Ratios Have Changed Since 2000
-

 Sports2 weeks ago
The Highest Earning Athletes in Seven Professional Sports
-

 Science2 weeks ago
Visualizing the Average Lifespans of Mammals
-

 Brands1 week ago
How Tech Logos Have Evolved Over Time