Datastream
Institutional Crypto Trading on Coinbase Reaches Record Volume
The Briefing
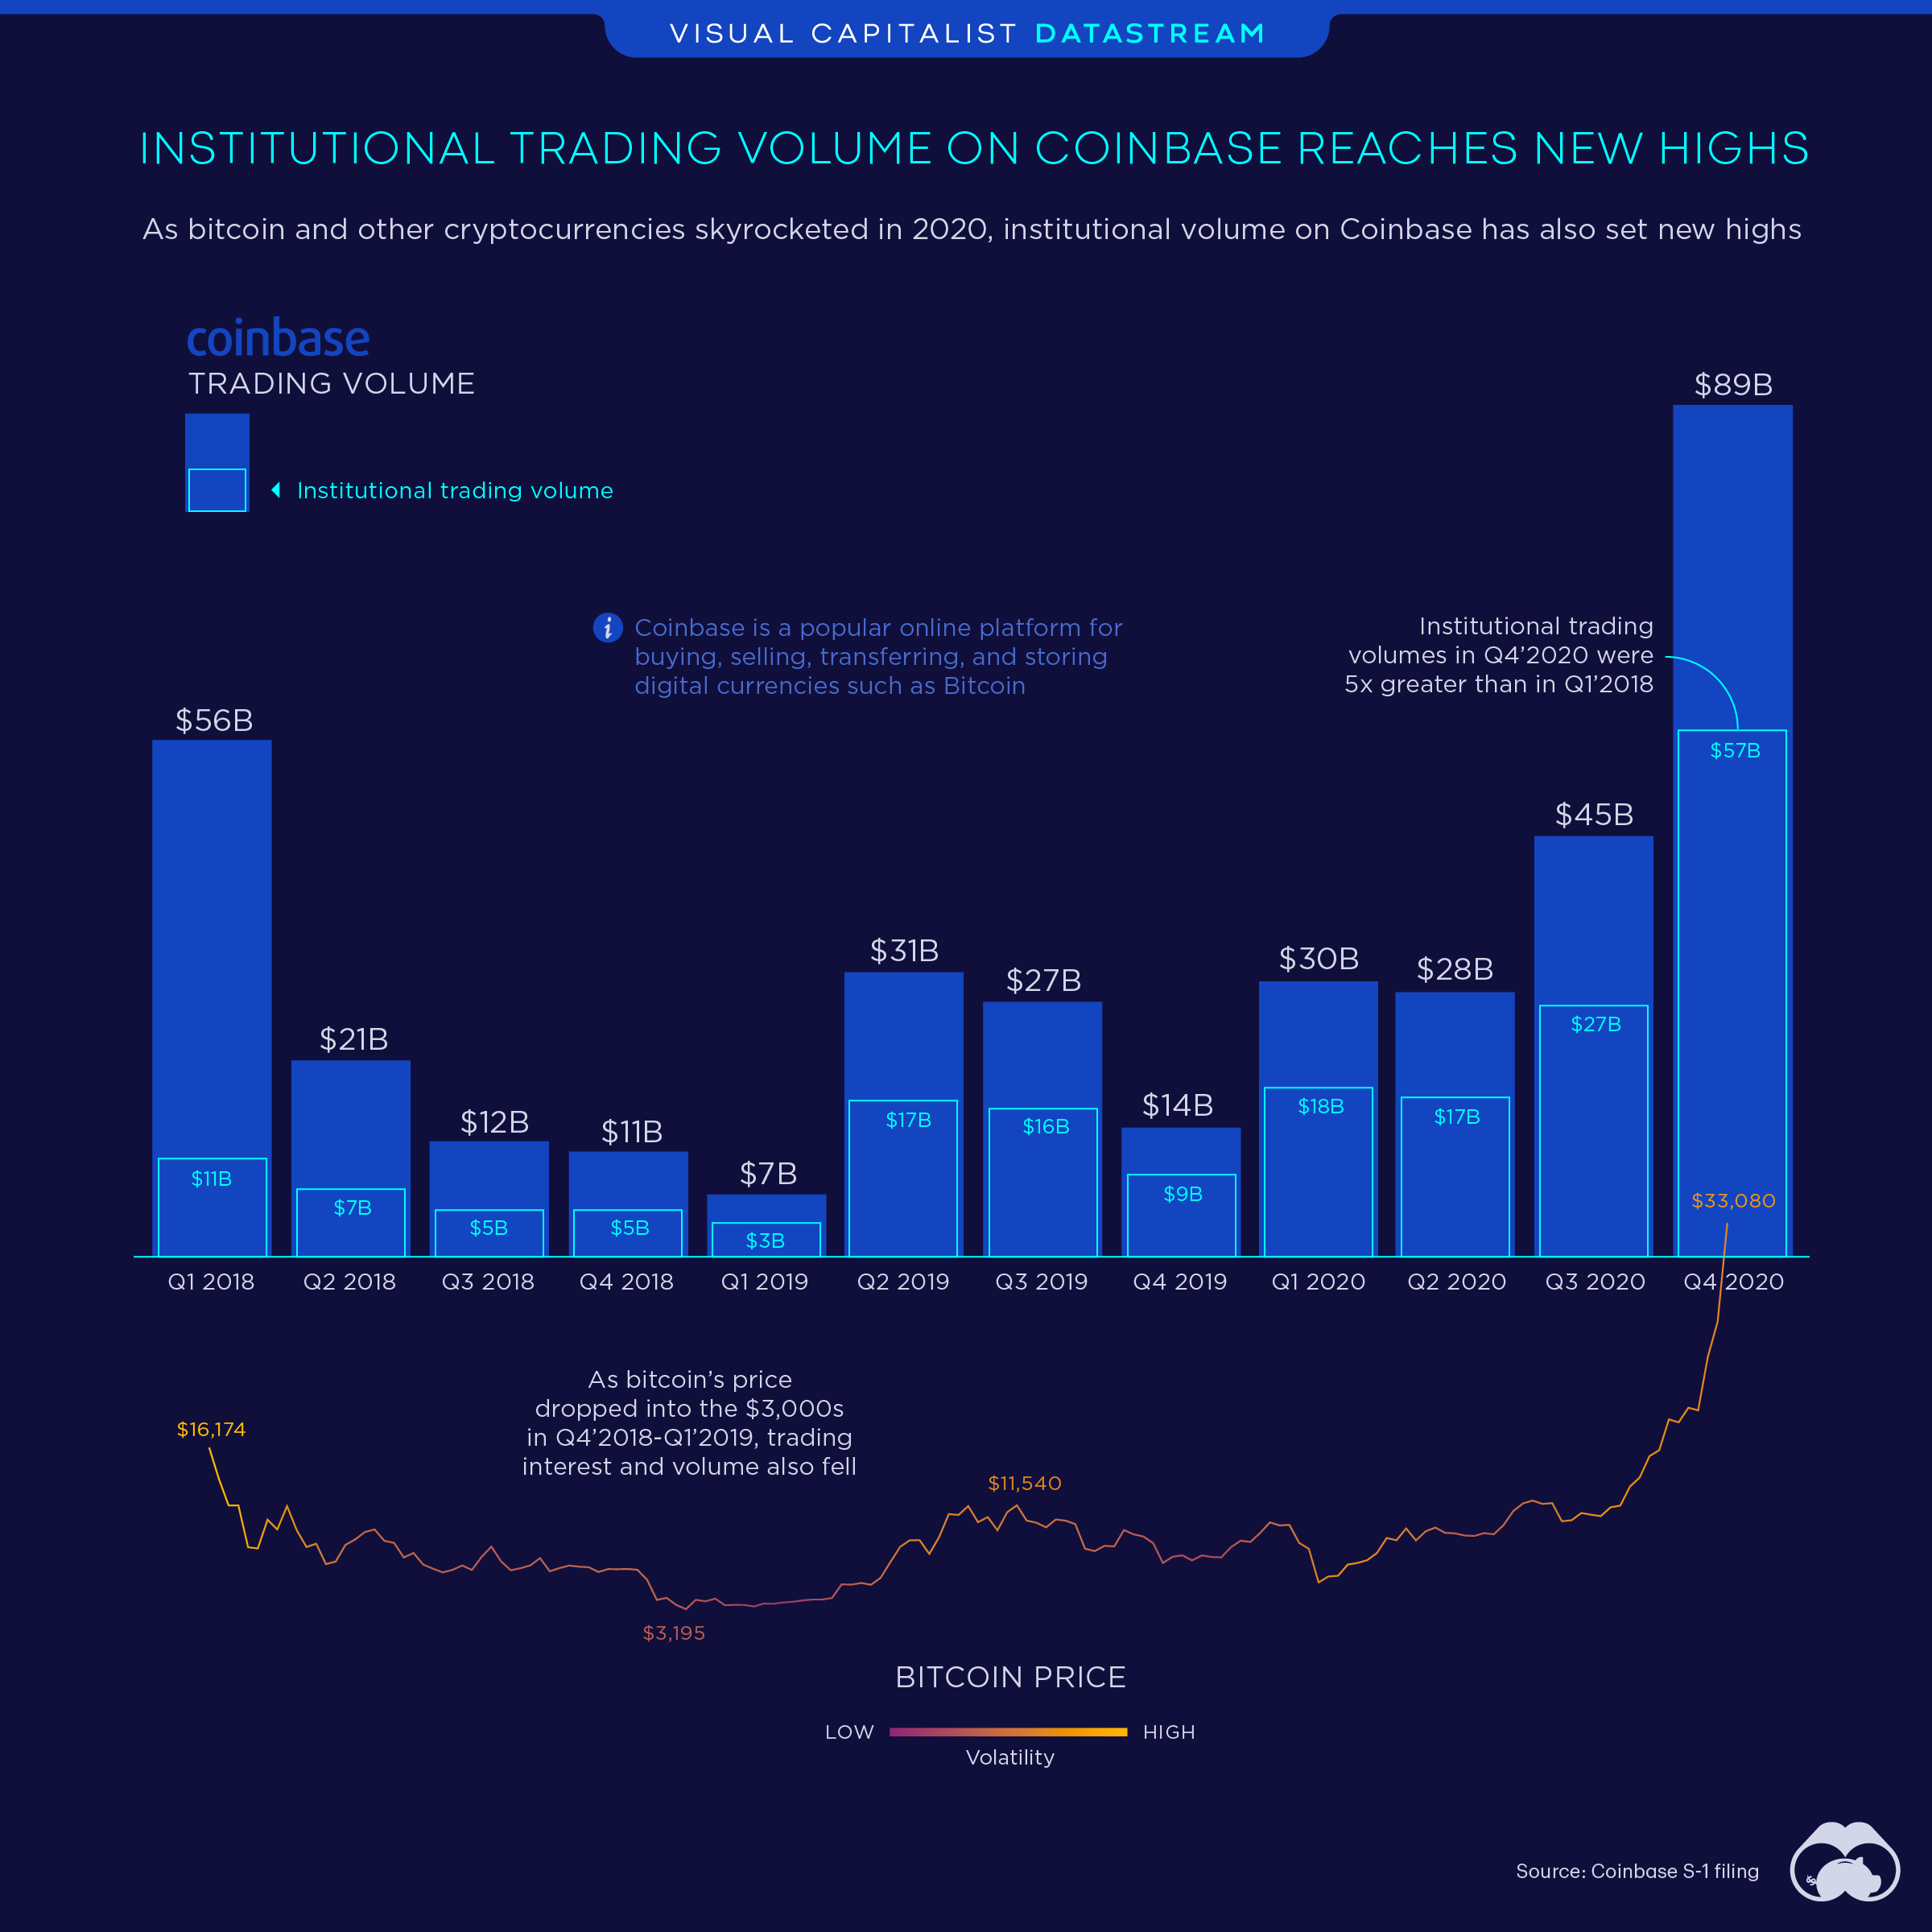
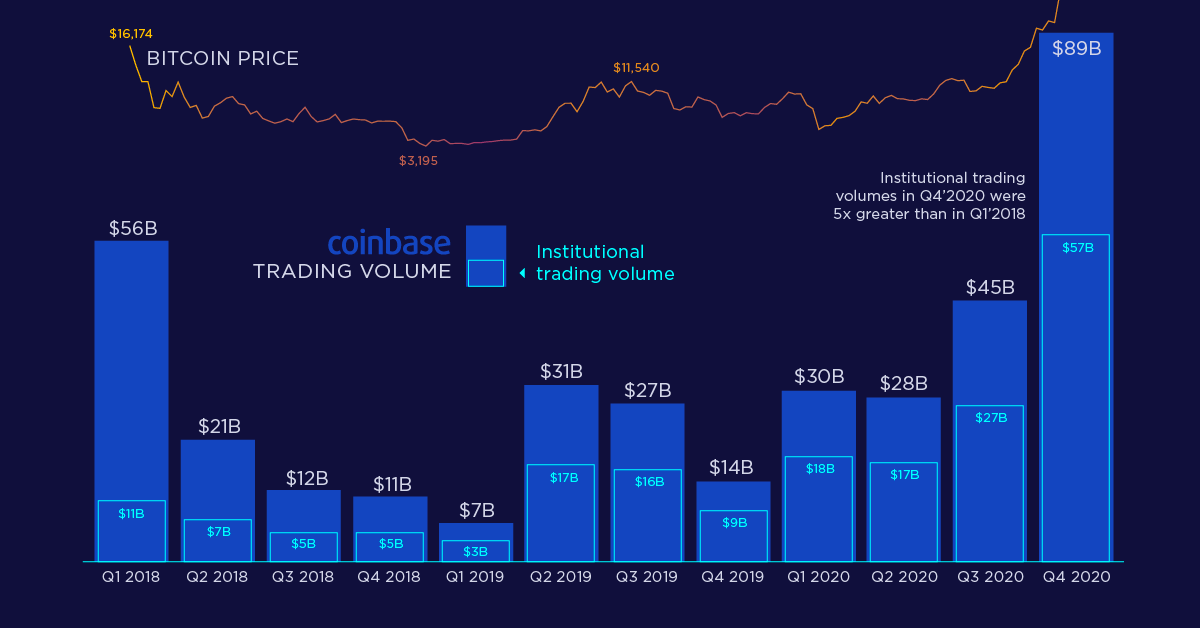
- Institutional trading volume on Coinbase has increased more than fivefold since Q1’2018 ($11B), reaching $57B in Q4’2020
- Despite the surge in institutional volume, retail volume has not reached the high set in Q1’2018
Coinbase’s Institutional Volume Surges Alongside Bitcoin’s Price
As Coinbase prepares to go public with a direct listing on the Nasdaq, the company has released its S-1 filing detailing just about every aspect of their business.
Along with surging users and crypto prices, Coinbase’s trading volume has also increased exponentially, with institutions leading the way.
This graphic looks at the return of rising institutional and retail trading volumes on Coinbase over the past two years alongside bitcoin’s price.
Coinbase’s Volume and Active Users are Rising
Crypto trading volume on Coinbase set record highs in Q4’2020 with $89B in volume, with institutions making up $57B. While recent institutional volume is more than five times Q1’2018 volume, retail trading volume is still below Q1’2018 levels despite bitcoin making new all-time highs.
Overall, trading volumes on Coinbase’s platform are far greater today than they were at the peak of the last bitcoin bull run. However, monthly transacting users on the exchange in Q4’2020 just barely surpassed the numbers of Q1’2018.
Coinbase’s Monthly Transacting Users per Quarter
| Date | Monthly Transacting Users (millions) |
|---|---|
| Q1'2018 | 2.7M |
| Q2'2018 | 1.2M |
| Q3'2018 | 0.9M |
| Q4'2018 | 0.9M |
| Q1'2019 | 0.8M |
| Q2'2019 | 1.3M |
| Q3'2019 | 1.2M |
| Q4'2019 | 1.0M |
| Q1'2020 | 1.3M |
| Q2'2020 | 1.5M |
| Q3'2020 | 2.1M |
| Q4'2020 | 2.8M |
Along with Coinbase’s volume figures showing a greater increase in institutional volume compared to retail, it’s clear that institutions have bought into the bull run while retail investors have returned to transacting crypto more slowly.
The Institutions Buying into the Bitcoin Bull Run
It began with Michael Saylor’s company MicroStrategy purchasing $250M worth of bitcoin in August of 2020, before eventually investing a total of $2.2B in the cryptocurrency. These aggressive bitcoin purchases were followed up by Jack Dorsey’s Square and Elon Musk’s Tesla investing $220M and $1.5B respectively, with Tesla also revealing plans to accept bitcoin payments in the future.
Along with these companies betting on bitcoin, banks have renewed their interest in cryptocurrency as well. Earlier this month the Bank of New York Mellon set up a digital assets unit to help customers manage their cryptocurrencies, and Goldman Sachs just announced the return of its cryptocurrency trading desk.
While it’s rumored that Goldman Sachs could even pursue listing a bitcoin-focused ETF, the Chicago Board Options Exchange has already filed a request with the SEC to list VanEck’s bitcoin ETF, which would be the first of its kind in the United States.
>>Like this? Then you might like this article comparing bitcoin’s market cap to other cryptocurrencies
Where does this data come from?
Source: Coinbase S-1 Filing
Details: Volatility on this graphic is Coinbase’s internal measure of crypto volatility in the market relative to prior periods.


Datastream
Can You Calculate Your Daily Carbon Footprint?
Discover how the average person’s carbon footprint impacts the environment and learn how carbon credits can offset your carbon footprint.


The Briefing
- A person’s carbon footprint is substantial, with activities such as food consumption creating as much as 4,500 g of CO₂ emissions daily.
- By purchasing carbon credits from Carbon Streaming Corporation, you can offset your own emissions and fund positive climate action.
Your Everyday Carbon Footprint
While many large businesses and countries have committed to net-zero goals, it is essential to acknowledge that your everyday activities also contribute to global emissions.
In this graphic, sponsored by Carbon Streaming Corporation, we will explore how the choices we make and the products we use have a profound impact on our carbon footprint.
Carbon Emissions by Activity
Here are some of the daily activities and products of the average person and their carbon footprint, according to Clever Carbon.
| Household Activities & Products | CO2 Emissions (g) |
|---|---|
| 💡 Standard Light Bulb (100 watts, four hours) | 172 g |
| 📱 Mobile Phone Use (195 minutes per day)* | 189 g |
| 👕 Washing Machine (0.63 kWh) | 275 g |
| 🔥 Electric Oven (1.56 kWh) | 675 g |
| ♨️ Tumble Dryer (2.5 kWh) | 1,000 g |
| 🧻 Toilet Roll (2 ply) | 1,300 g |
| 🚿 Hot Shower (10 mins) | 2,000 g |
| 🚙 Daily Commute (one hour, by car) | 3,360 g |
| 🍽️ Average Daily Food Consumption (three meals of 600 calories) | 4,500 g |
| *Phone use based on yearly use of 69kg per the source, Reboxed | |
Your choice of transportation plays a crucial role in determining your carbon footprint. For instance, a 15 km daily commute to work on public transport generates an average of 1,464 g of CO₂ emissions. Compared to 3,360 g—twice the volume for a journey the same length by car.
By opting for more sustainable modes of transport, such as cycling, walking, or public transportation, you can significantly reduce your carbon footprint.
Addressing Your Carbon Footprint
One way to compensate for your emissions is by purchasing high-quality carbon credits.
Carbon credits are used to help fund projects that avoid, reduce or remove CO₂ emissions. This includes nature-based solutions such as reforestation and improved forest management, or technology-based solutions such as the production of biochar and carbon capture and storage (CCS).
While carbon credits offer a potential solution for individuals to help reduce global emissions, public awareness remains a significant challenge. A BCG-Patch survey revealed that only 34% of U.S. consumers are familiar with carbon credits, and only 3% have purchased them in the past.
About Carbon Streaming
By financing the creation or expansion of carbon projects, Carbon Streaming Corporation secures the rights to future carbon credits generated by these sustainable projects. You can then purchase these carbon credits to help fund climate solutions around the world and compensate for your own emissions.
Ready to get involved?
>> Learn more about purchasing carbon credits at Carbon Streaming

-

 Energy1 week ago
The World’s Biggest Nuclear Energy Producers
-

 Money2 weeks ago
Which States Have the Highest Minimum Wage in America?
-

 Technology2 weeks ago
Ranked: Semiconductor Companies by Industry Revenue Share
-

 Markets2 weeks ago
Ranked: The World’s Top Flight Routes, by Revenue
-

 Countries2 weeks ago
Population Projections: The World’s 6 Largest Countries in 2075
-

 Markets2 weeks ago
The Top 10 States by Real GDP Growth in 2023
-

 Demographics2 weeks ago
The Smallest Gender Wage Gaps in OECD Countries
-

 United States2 weeks ago
Where U.S. Inflation Hit the Hardest in March 2024