Misc
Infographic: The Longest Lasting Cars, in Miles


Infographic: The Longest Lasting Cars, in Miles
When properly maintained, well-built cars can last an impressive amount of miles.
Consider this 2006 Honda Civic, which hit one million miles on its original engine and transmission. Amusingly, the car’s odometer maxes out at 999,999 miles.
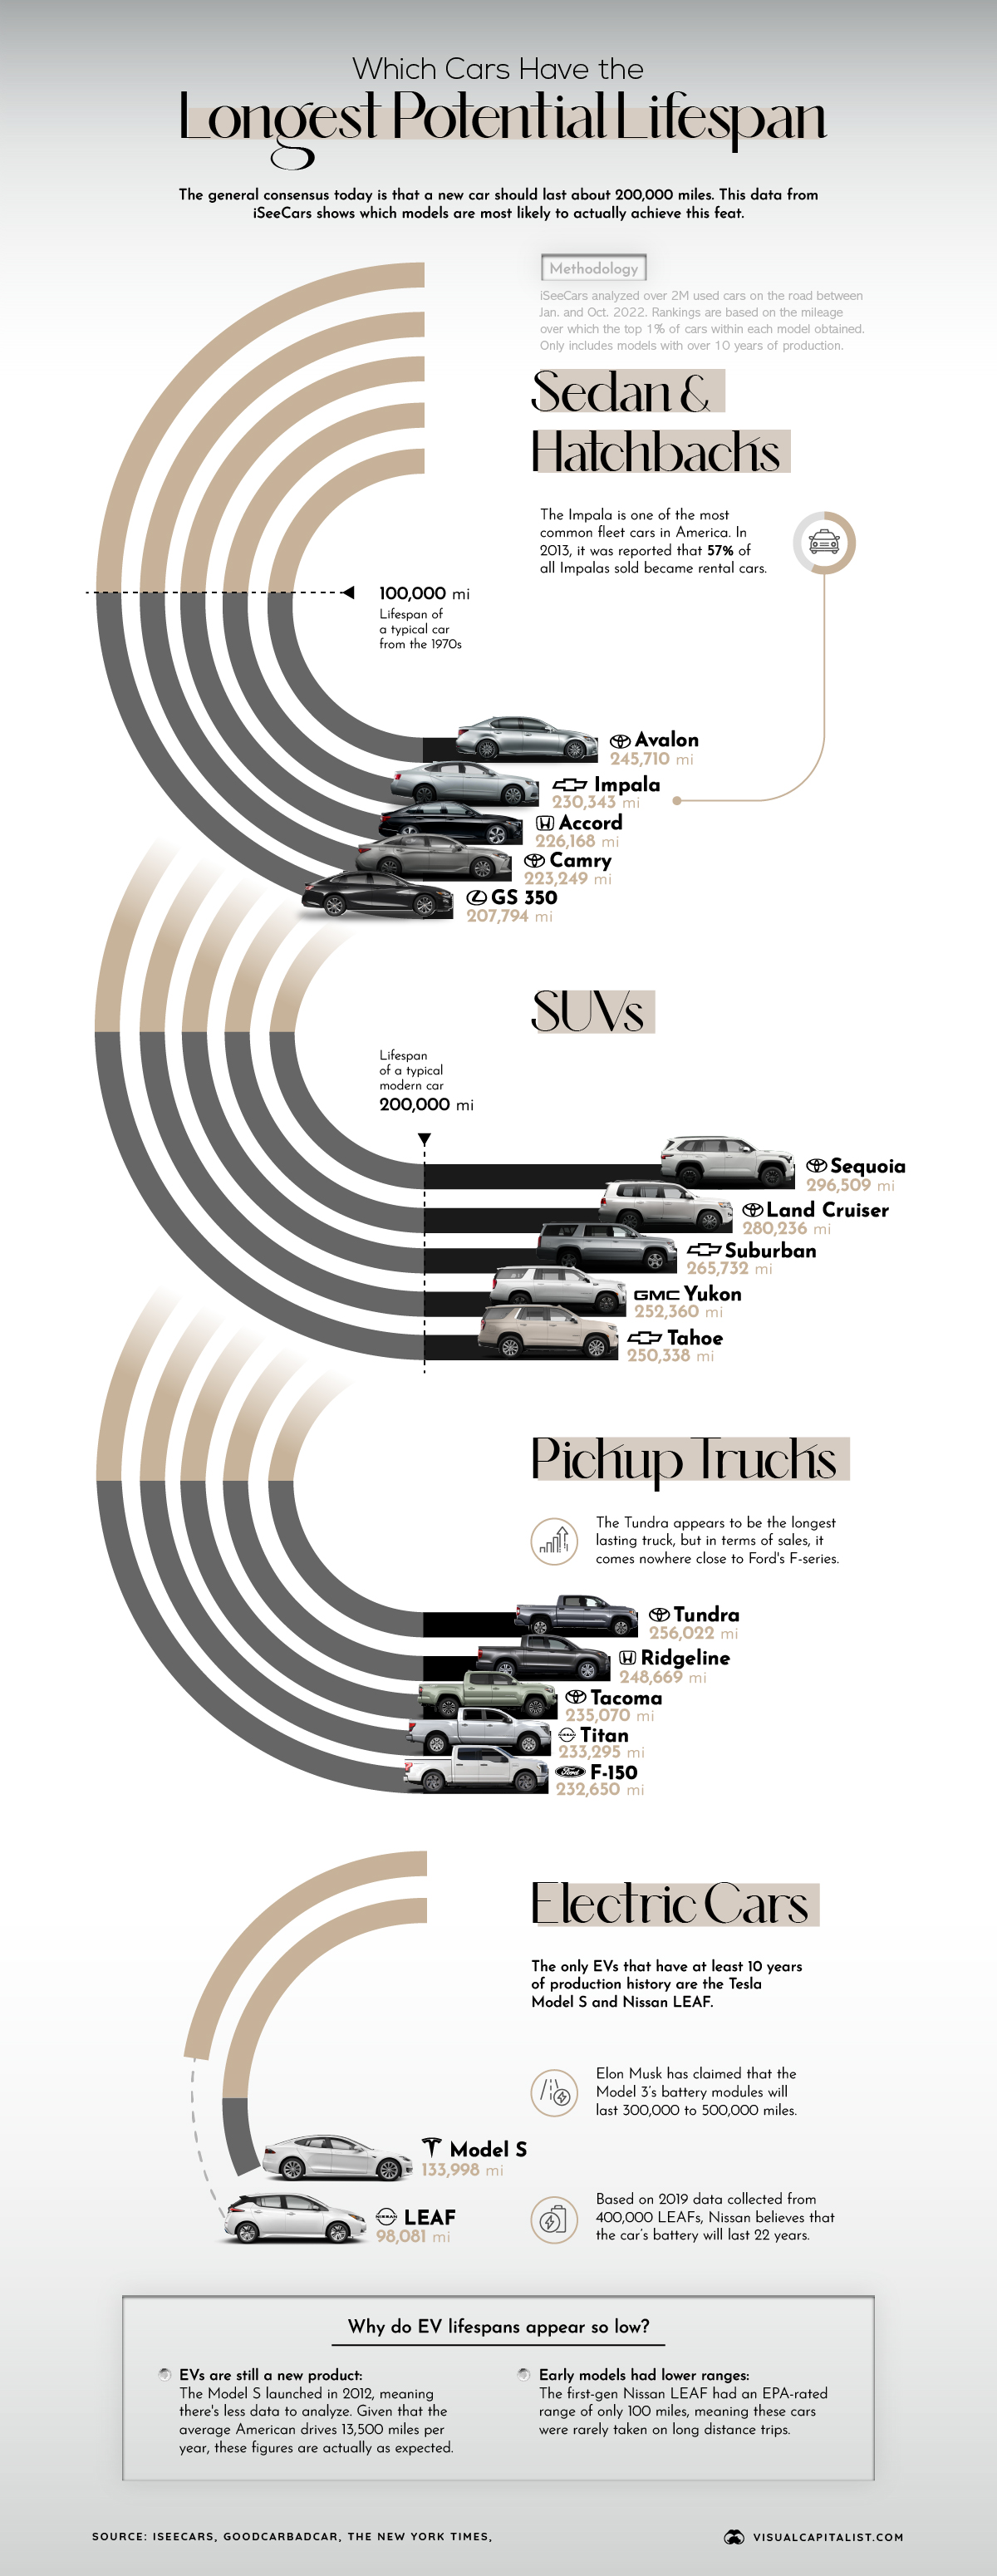
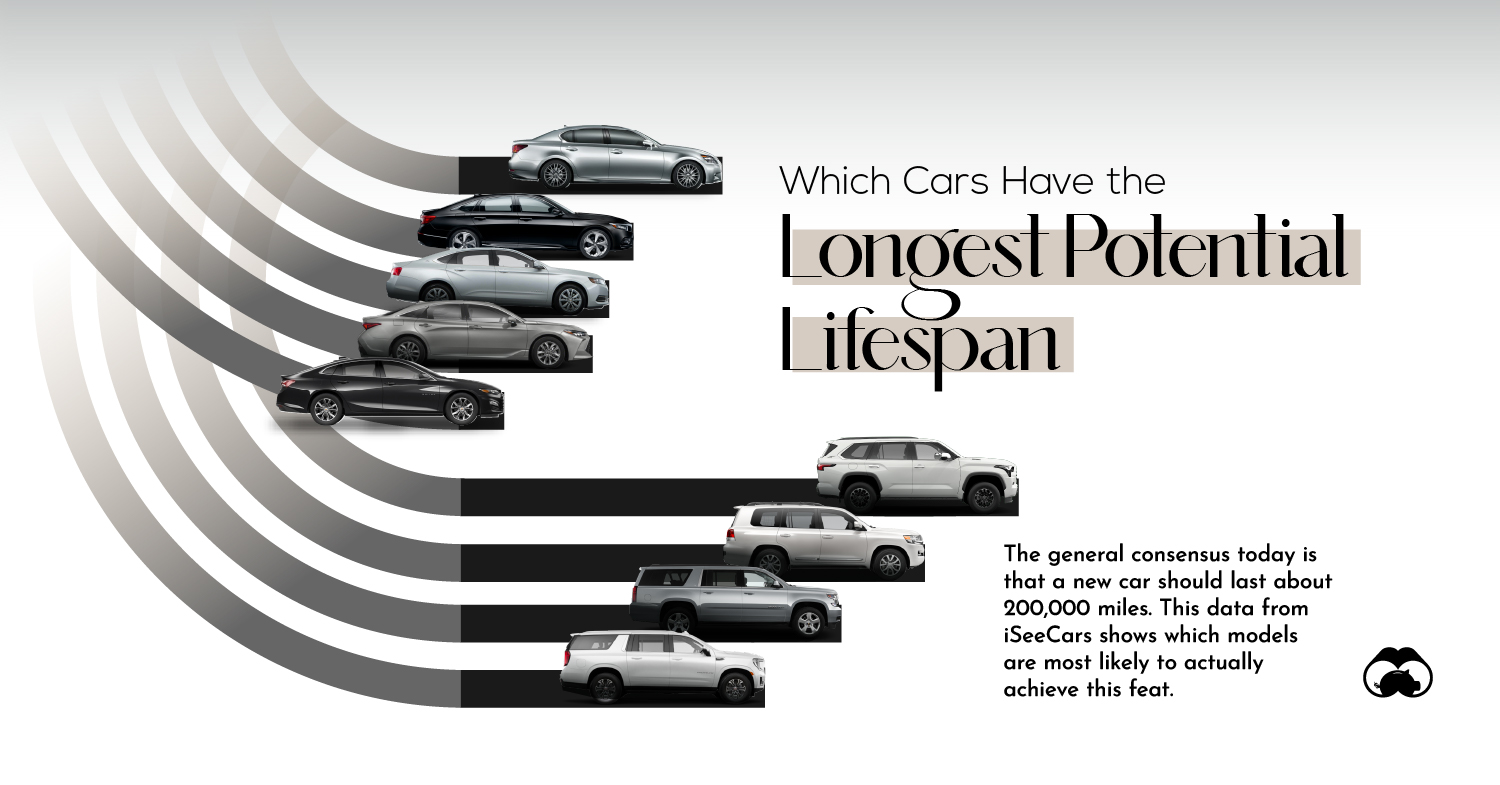
While that case may be an extreme outlier, most modern cars are expected to last 200,000 miles before experiencing some significant failure. That’s roughly double the lifespan of cars from the 1960s and 1970s, which typically lasted about 100,000 miles.
In this infographic, we used data from iSeeCars to determine which cars are the most likely to reach— or even surpass—the 200,000 mile benchmark.
Study Methodology & Data
To come up with their rankings, iSeeCars analyzed over 2 million used cars between January and October 2022. The rankings are based on the mileage that the top 1% of cars within each model obtained. Models with less than 10 years of production, such as the Tesla Model 3, were excluded.
The following tables show an expanded list of the longest lasting cars, by model category. Our infographic only includes the top five from each.
Sedans & Hatchbacks
The only non-Japanese model in the top 10 is the Chevrolet Impala, which is one of the most commonly found rental cars in the U.S.
| Rank | Vehicle | Potential Lifespan (miles) |
|---|---|---|
| 1 | 🇯🇵 Toyota Avalon | 245,710 |
| 2 | 🇺🇸 Chevrolet Impala | 230,343 |
| 3 | 🇯🇵 Honda Accord | 226,168 |
| 4 | 🇯🇵 Toyota Camry | 223,249 |
| 5 | 🇯🇵 Lexus GS 350 | 207,794 |
| 6 | 🇯🇵 Honda Fit | 207,231 |
| 7 | 🇯🇵 Honda Civic | 205,335 |
| 8 | 🇯🇵 Lexus ES 350 | 204,642 |
| 9 | 🇯🇵 Toyota Corolla | 204,266 |
| 10 | 🇯🇵 Mazda 6 | 203,154 |
Another interesting takeaway is that Lexus is the only luxury brand in this list. This is likely due to the fact that Lexus and Toyota often share drivetrain components.
SUVs
iSeeCars has a larger top 20 list for the SUV category.
| Rank | Vehicle | Potential Lifespan |
|---|---|---|
| 1 | 🇯🇵 Toyota Sequoia | 296,509 |
| 2 | 🇯🇵 Toyota Land Cruiser | 280,236 |
| 3 | 🇺🇸 Chevrolet Suburban | 265,732 |
| 4 | 🇺🇸 GMC Yukon XL | 252,360 |
| 5 | 🇺🇸 Chevrolet Tahoe | 250,338 |
| 6 | 🇯🇵 Toyota Highlander Hybrid | 244,994 |
| 7 | 🇺🇸 Ford Expedition | 244,682 |
| 8 | 🇯🇵 Toyota 4Runner | 244,665 |
| 9 | 🇺🇸 GMC Yukon | 238,956 |
| 10 | 🇯🇵 Honda Pilot | 236,807 |
| 11 | 🇯🇵 Acura MDX | 228,472 |
| 12 | 🇺🇸 Cadillac Escalade ESV | 228,449 |
| 13 | 🇺🇸 Cadillac Escalade | 224,782 |
| 14 | 🇺🇸 Lincoln Navigator | 220,319 |
| 15 | 🇯🇵 Nissan Armada | 220,172 |
| 16 | 🇯🇵 Toyota Highlander | 218,075 |
| 17 | 🇯🇵 Honda CR-V | 215,930 |
| 18 | 🇺🇸 Lincoln Navigator L | 214,341 |
| 19 | 🇯🇵 Subaru Outback | 208,298 |
| 20 | 🇰🇷 Hyundai Santa Fe | 206,398 |
This is a more diverse list, with American and Japanese models seemingly on par. The GM family of SUVs (Tahoe, Suburban, Yukon, and Yukon XL) are narrowly edged out by Toyota’s full size options (Sequoia and Land Cruiser).
The Land Cruiser was discontinued in the U.S. for 2021, but it remains a very popular model in Middle Eastern countries like Bahrain, Qatar, and the UAE.
Pickup Trucks
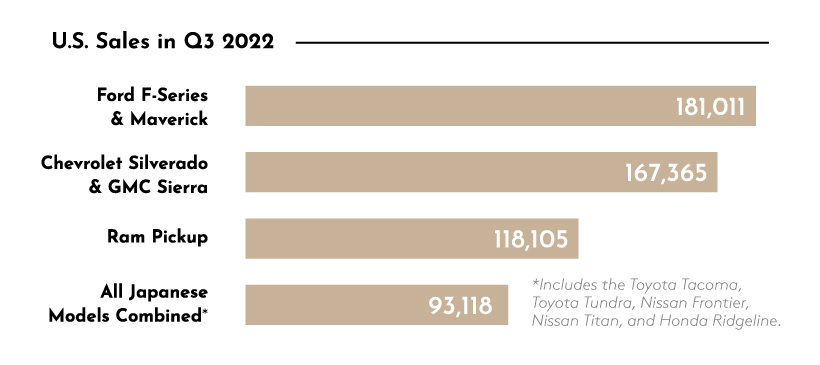
Once again, Japanese manufacturers hold the top spots. According to Toyota, the Tundra is the only full-size pickup that is currently being built in Texas.
| Rank | Vehicle | Potential Lifespan |
|---|---|---|
| 1 | 🇯🇵 Toyota Tundra | 256,022 |
| 2 | 🇯🇵 Honda Ridgeline | 248,669 |
| 3 | 🇯🇵 Toyota Tacoma | 235,070 |
| 4 | 🇯🇵 Nissan Titan | 233,295 |
| 5 | 🇺🇸 Ford F-150 | 232,650 |
| 6 | 🇺🇸 Chevrolet Silverado 1500 | 230,515 |
| 7 | 🇺🇸 GMC Sierra 1500 | 222,691 |
| 8 | 🇺🇸 Ford Ranger | 220,980 |
| 9 | 🇯🇵 Nissan Frontier | 215,775 |
| 10 | 🇺🇸 Ram 1500 | 215,521 |
Despite their marginally higher potential lifespans, sales of Japanese trucks come nowhere close to their American counterparts.
Electric Cars
The last category is EVs, which due to the 10 years of production requirement, only includes the Tesla Model S (133,998 miles) and Nissan LEAF (98,081).
These figures are much lower than the gasoline cars discussed above, but it’s not exactly a fair comparison. We probably won’t be able to judge the long-term reliability of EVs until they’ve been around for at least another decade.
In addition to needing more time, another reason is scale—the Model S and LEAF have been sold in relatively limited numbers. The Tesla Model 3, which is the first EV to sell over one million units, will likely become the first reliable benchmark.


Politics
Charted: Trust in Government Institutions by G7 Countries
How much do you trust the government and its various institutions? We look at data for G7 countries for the time period of 2006-2023.


Trust in Government Institutions by G7 Countries
This was originally posted on our Voronoi app. Download the app for free on iOS or Android and discover incredible data-driven charts from a variety of trusted sources.
How much do you trust the government, and its various institutions?
It’s likely that your level of confidence probably depends on a wide range of factors, such as perceived competency, historical context, economic performance, accountability, social cohesion, and transparency.
And for these same reasons, trust levels in government institutions also change all the time, even in the world’s most developed countries: the G7.
Confidence in Government by G7 Countries (2006-2023)
This chart looks at the changes in trust in government institutions between the years 2006 and 2023, based on data from a multi-country Gallup poll.
Specifically, this dataset aggregates confidence in multiple national institutions, including the military, the judicial system, the national government, and the integrity of the electoral system.
| Country | Confidence (2006) | Confidence (2023) | Change (p.p.) |
|---|---|---|---|
| Canada | 57% | 64% | +7 |
| Britain | 63% | 63% | +0 |
| Germany | 55% | 61% | +6 |
| France | 54% | 60% | +6 |
| Japan | 48% | 59% | +11 |
| Italy | 41% | 54% | +13 |
| United States | 63% | 50% | -13 |
What’s interesting here is that in the G7, a group of the world’s most developed economies, there is only one country bucking the general trend: the United States.
Across most G7 countries, confidence in institutions has either improved or stayed the same between 2006 and 2023. The largest percentage point (p.p.) increases occur in Italy and Japan, which saw +13 p.p. and +11 p.p. increases in trust over the time period.
In the U.S., however, confidence in government institutions has fallen by 13 p.p. over the years. What happened?
Key Figures on U.S. Trust in Institutions
In 2006, the U.S. was tied with the UK as having the highest confidence in government institutions, at 63%.
But here’s where the scores stand in 2023, across various institutions:
| 🇺🇸 Institutions | Confidence (2023) |
|---|---|
| Military | 81% |
| Judiciary | 42% |
| National Government | 30% |
| Elections | 44% |
| Overall | 49% |
Based on this data, it’s clear that the U.S. lags behind in three key indicators: confidence in the national government, confidence in the justice system, and confidence in fair elections. It ranked in last place for each indicator in the G7.
One other data point that stands out: despite leading the world in military spending, the U.S. is only the third most confident in its military in the G7. It lags behind France (86%) and the United Kingdom (83%).

-

 Technology7 days ago
All of the Grants Given by the U.S. CHIPS Act
-

 Misc2 weeks ago
How Hard Is It to Get Into an Ivy League School?
-

 Debt2 weeks ago
How Debt-to-GDP Ratios Have Changed Since 2000
-

 Sports2 weeks ago
The Highest Earning Athletes in Seven Professional Sports
-

 Science2 weeks ago
Visualizing the Average Lifespans of Mammals
-

 Brands1 week ago
How Tech Logos Have Evolved Over Time
-

 Energy1 week ago
Ranked: The Top 10 EV Battery Manufacturers in 2023
-

 Demographics1 week ago
Countries With the Largest Happiness Gains Since 2010