Economy
How Much Land does the U.S. Military Control in Each State?


How Much Land does the U.S. Military Own in Each State?
The United States spends an unparalleled amount of money on its military—about $778 billion each year to be precise.
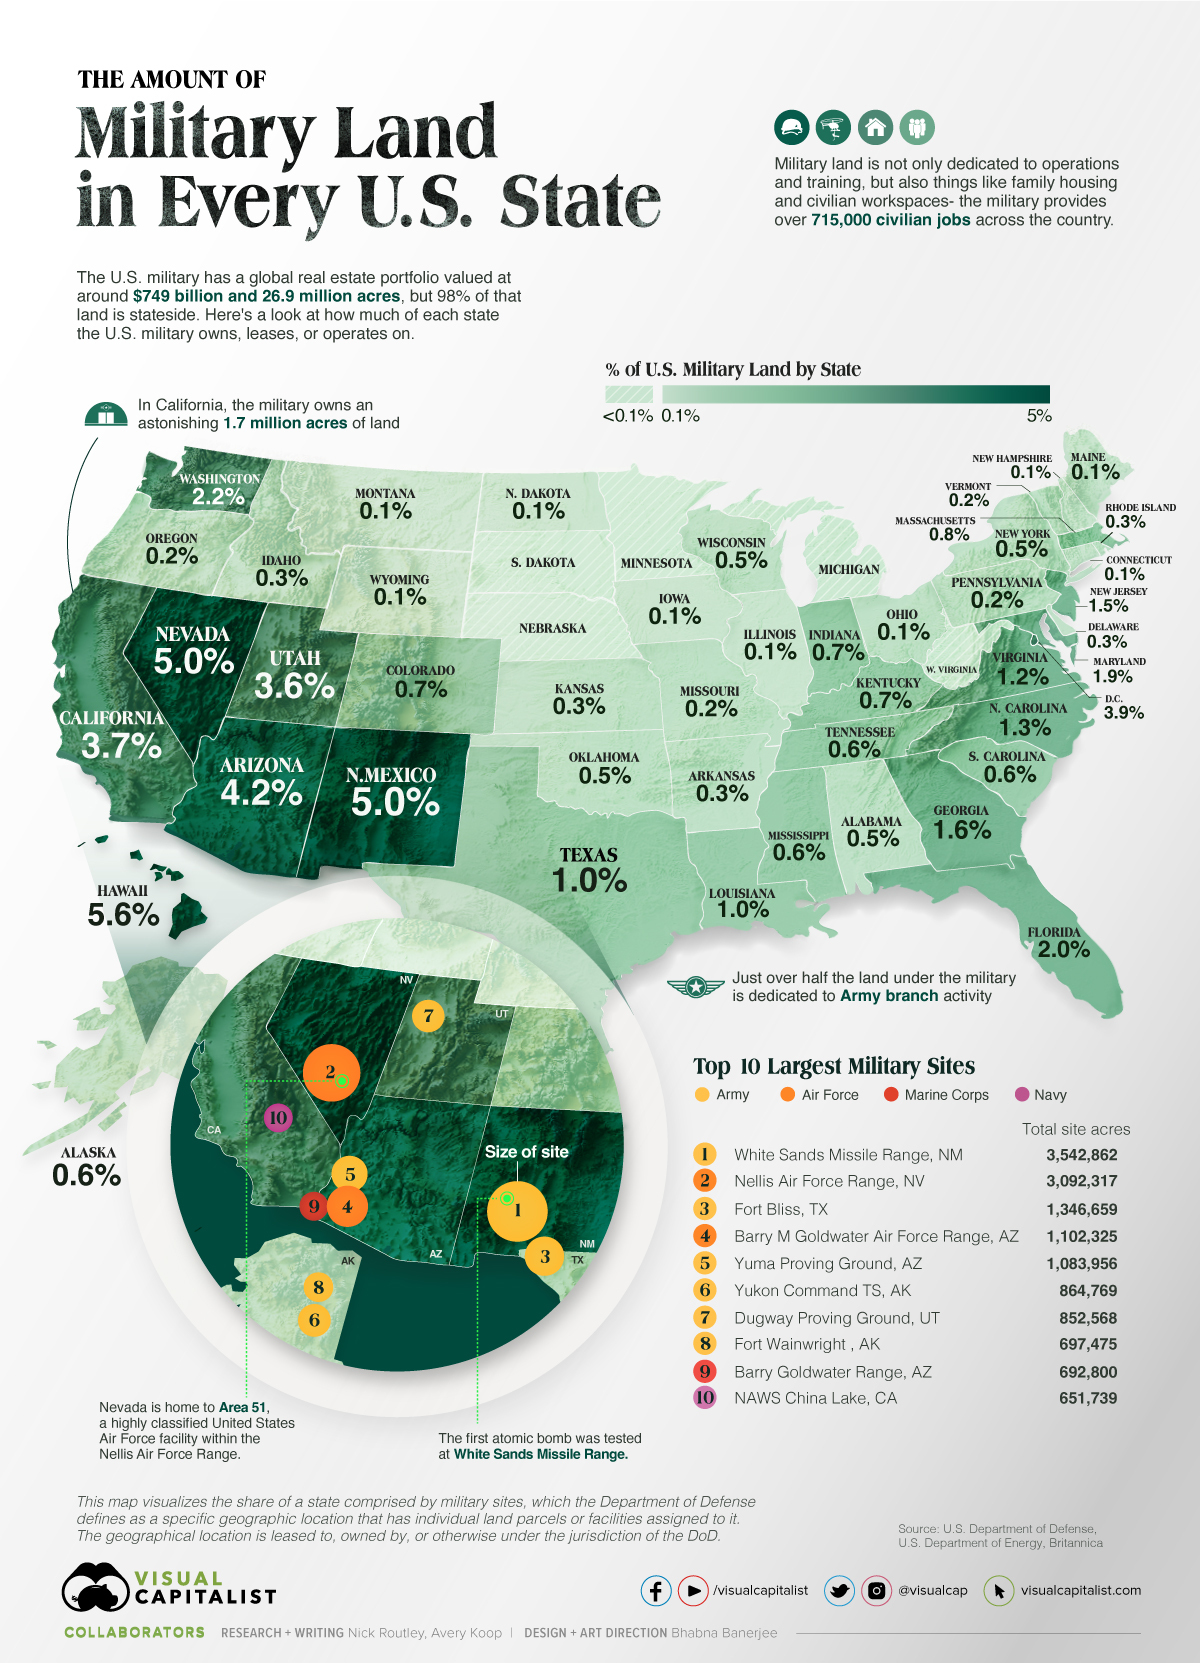
Additionally, the U.S. military also owns, leases, or operates an impressive real estate portfolio with buildings valued at $749 billion and a land area of 26.9 million acres, of which around 98% is located within the United States.
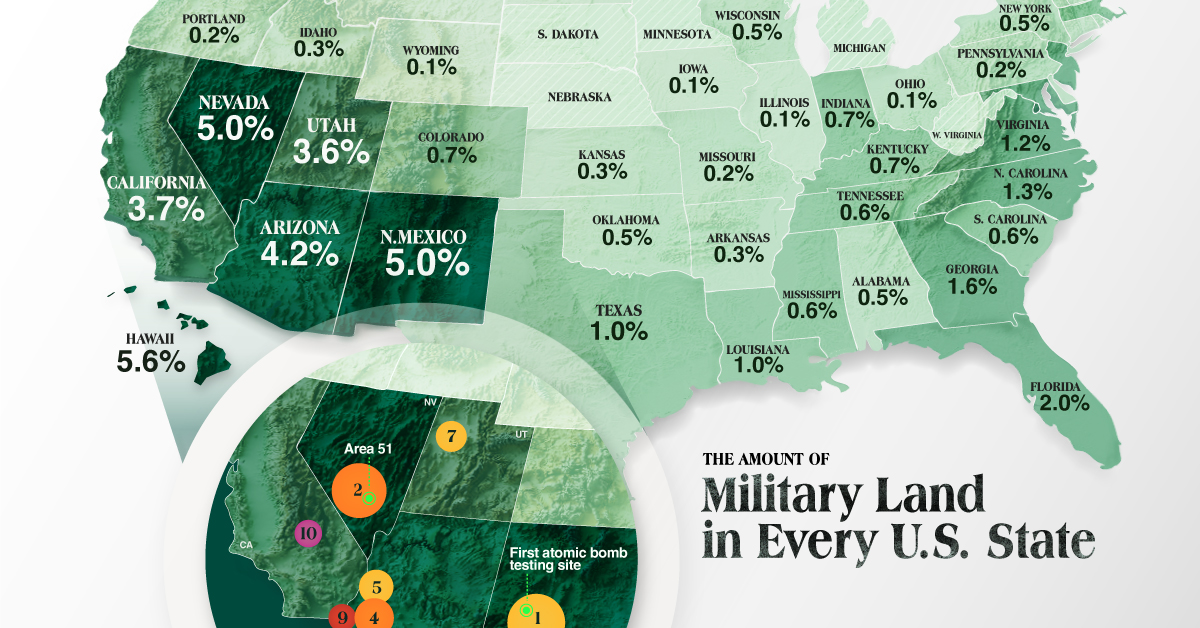
This visual, using data from the Department of Defense (DoD) reveals how much of each state the U.S. military owns, leases, or operates on.
This map visualizes the share of a state comprised by military sites, which the Department of Defense defines as a specific geographic location that has individual land parcels or facilities assigned to it. The geographical location is leased to, owned by, or otherwise under the jurisdiction of the DoD.
What is Military Land Used For?
The DoD is the larger government umbrella under which the military falls and the department operates on over 26 million acres of land stateside.
To further break it down the U.S. military is divided into four main branches:
- Army
- Navy
- Air Force
- Marine Corps
There is also the Space Force, the Coast Guard, and the National Guard. However, most of the land is dedicated to the Army, which is the military’s largest branch.
Military bases are used for training and housing soldiers, testing weapons and equipment, conducting research, and running active operations, among other things. A large majority of the square footage is actually designated for family housing.
For example, Fort Bragg, North Carolina, which is one of the most famous U.S. Army bases, is home to more than 260,000 people including the families of soldiers. The base, which is virtually its own city, is the largest U.S. Army installation with 53,700 troops—nearly 10% of the Army—and over 14,000 civilian employees.
Which States Have the Biggest Military Presence?
Looking at the largest total sites, the top 10 combined cover an astonishing 13,927,470 acres, larger than 10 individual states including New Jersey, Massachusetts, and Hawaii.
Here’s a look at the size of the military’s sites in each state and how much of that state’s land the sites take up:
| State | Site (Acres) | Share of State's Total Land |
|---|---|---|
| Hawaii | 228,639 | 5.6% |
| Nevada | 3,541,949 | 5.0% |
| New Mexico | 3,889,638 | 5.0% |
| Arizona | 3,042,028 | 4.2% |
| District of Columbia | 1,525 | 3.9% |
| California | 3,655,180 | 3.7% |
| Utah | 1,883,234 | 3.6% |
| Washington | 941,146 | 2.2% |
| Florida | 690,994 | 2.0% |
| Maryland | 115,158 | 1.9% |
| Georgia | 589,060 | 1.6% |
| New Jersey | 71,822 | 1.5% |
| North Carolina | 411,152 | 1.3% |
| Virginia | 289,815 | 1.2% |
| Texas | 1,690,725 | 1.0% |
| Louisiana | 272,357 | 1.0% |
| Massachusetts | 39,107 | 0.8% |
| Colorado | 476,056 | 0.7% |
| Kentucky | 180,852 | 0.7% |
| Indiana | 160,103 | 0.7% |
| Mississippi | 176,745 | 0.6% |
| South Carolina | 109,938 | 0.6% |
| Alaska | 2,057,351 | 0.6% |
| Tennessee | 147,839 | 0.6% |
| Alabama | 166,800 | 0.5% |
| Oklahoma | 223,632 | 0.5% |
| New York | 152,611 | 0.5% |
| Wisconsin | 155,500 | 0.5% |
| Rhode Island | 2,280 | 0.3% |
| Delaware | 4,170 | 0.3% |
| Kansas | 140,973 | 0.3% |
| Arkansas | 88,072 | 0.3% |
| Idaho | 136,350 | 0.3% |
| Oregon | 140,294 | 0.2% |
| Pennsylvania | 61,323 | 0.2% |
| Missouri | 88,240 | 0.2% |
| Vermont | 1,1520 | 0.2% |
| Ohio | 35,150 | 0.1% |
| Maine | 18,742 | 0.1% |
| Illinois | 31,165 | 0.1% |
| North Dakota | 31,937 | 0.1% |
| Iowa | 24,506 | 0.1% |
| Montana | 56,998 | 0.1% |
| Connecticut | 1,753 | 0.1% |
| New Hampshire | 3,225 | 0.1% |
| Wyoming | 31,984 | 0.1% |
| Nebraska | 21,272 | 0.04% |
| Michigan | 14,004 | 0.04% |
| West Virginia | 3,084 | 0.02% |
| South Dakota | 9,681 | 0.02% |
| Minnesota | 2,736 | 0.01% |
In Hawaii, 5.6% of the state belongs to the military. The historic Pearl Harbor on the island of Oahu is still an active base, housing both the Navy and the Air Force.
In the nation’s capital, Washington D.C., 3.9% of the small district is owned or operated on by the military—there are approximately 18 independent sites in the city.
Most of the DoD’s land is in the southwestern United States. One major benefit is that there are areas large enough in these states to test hugely destructive weapons without harming anyone. The atomic bomb was first detonated in the middle of nowhere in New Mexico at the White Sands Missile Range, the biggest military site in the country.
Almost all of the largest military sites fall under the Army branch, which has over 415,000 active personnel. Here’s a look at the U.S. military breakdown in terms of population:
- Active Duty:
- Army: 415,967
- Navy: 304,118
- Marine Corps: 146,728
- Air Force (also includes Space Force): 273,983
- Coast Guard: 38,829
- Reserves: 438,645
Beyond just the presence of soldiers across the states, the military also represents a lot of jobs. In total, both on U.S. soil and globally the DoD provides nearly 2.9 million jobs from active duty troops to civilian positions within the military. In California, for example, the military provides over 62,000 civilian jobs.
U.S. Military Presence Beyond its Borders
When it comes to all the land that the military both owns and leases globally, the figure is huge, coming out to 26.9 million acres. The Army controls 51% of the DoD’s land, followed by the Air Force’s 32%.
Military land owned by the DoD can be found outside the U.S. in 8 territories and 45 foreign countries. Here’s a breakdown of where the majority of the U.S.’ foreign bases are:
- 🇩🇪 Germany: 194 sites
- 🇯🇵 Japan: 121 sites
- 🇰🇷 South Korea: 83 sites
In places where there are ongoing conflicts, the U.S. has a few permanent forces. In regular times in Ukraine, there are 23 active duty soldiers permanently stationed. In Russia there are 41 active duty U.S. troops. However, President Joe Biden has recently announced that he will increase the U.S.’ military presence across Europe because of the war in Ukraine.


Misc
Visualizing the Most Common Pets in the U.S.
Lions, tigers, and bears, oh my!—these animals do not feature on this list of popular American household pets.


Visualizing The Most Common Pets in the U.S.
This was originally posted on our Voronoi app. Download the app for free on iOS or Android and discover incredible data-driven charts from a variety of trusted sources.
In this graphic, we visualized the most common American household pets, based on 2023-2024 data from the American Pet Products Association (accessed via Forbes Advisor).
Figures represent the number of households that own each pet type, rather than the actual number of each animal. The “small animal” category includes hamsters, gerbils, rabbits, guinea pigs, chinchillas, mice, rats, and ferrets.
What is the Most Popular American Household Pet?
Based on this data, dogs—one of the first domesticated animals—are the most common pets in the United States. In fact, around 65 million households own a dog, and spend an average of $900 a year on their care.
| Rank | Species | Households |
|---|---|---|
| 1 | 🐶 Dog | 65M |
| 2 | 🐱 Cat | 47M |
| 3 | 🐟 Freshwater Fish | 11M |
| 4 | 🐰 Small Animals | 7M |
| 5 | 🐦 Bird | 6M |
| 6 | 🦎 Reptile | 6M |
| 7 | 🐴 Horse | 2M |
| 8 | 🐠 Saltwater Fish | 2M |
Note: Households can own multiple pets, and are counted for all relevant categories.
Cats rank second, at 47 million households, and these smaller felines are a little less expensive to own at $700/year according to Forbes estimates.
But aside from these two juggernauts, there are plenty of other common pet types found in households across the country.
Freshwater fish can be found in 11 million households, along with small animals—rabbits, hamsters, guinea pigs—in 7 million. Meanwhile, nearly 6 million homes have birds or reptiles.
Pet Ownership is on the Rise in America
Forbes found that 66% of all American households (numbering 87 million) own at least one pet, up from 56% in 1988. One third of these (29 million) own multiple pets.
A combination of factors is driving this increase: rising incomes, delayed childbirth, and of course the impact of the pandemic which nearly cleared out animal shelters across the globe.
America’s loneliness epidemic may also be a factor. Fledgling research has shown that single-individual households with pets recorded lower rates of loneliness during the pandemic than those without a pet.

-

 Brands6 days ago
How Tech Logos Have Evolved Over Time
-

 Demographics2 weeks ago
The Smallest Gender Wage Gaps in OECD Countries
-

 Economy2 weeks ago
Where U.S. Inflation Hit the Hardest in March 2024
-

 Green2 weeks ago
Top Countries By Forest Growth Since 2001
-

 United States2 weeks ago
Ranked: The Largest U.S. Corporations by Number of Employees
-

 Maps2 weeks ago
The Largest Earthquakes in the New York Area (1970-2024)
-

 Green2 weeks ago
Ranked: The Countries With the Most Air Pollution in 2023
-

 Green2 weeks ago
Ranking the Top 15 Countries by Carbon Tax Revenue