Money
How Americans Make and Spend Their Money, by Age Group
If you’re like most people, your income and spending changes significantly as you get older.
In the most common career trajectory, earlier years coincide with a lower salary as skills and experience grow. Then, peak earning years are achieved in late adulthood, and eventually retirement comes onto the horizon.
Is this typical earnings arc supported by data?
Income and Spending, by Age
The data visualizations in today’s post come to us from Engaging Data and they use Sankey diagrams to display data from the Bureau of Labor Statistics (BLS) showing differences in how various age groups in America earn and spend their money.
The four charts below will show household data based on the age of the primary resident:
- Less than 25 years old (Very early career)
- Between 25-34 years old (Early career)
- Between 45-54 years old (Peak earning and spending)
- More than 75 years old (Retirement)
Let’s take a look at the collection of data, to see how it shakes out.
Less than 25 Years Old – $31,102 in spending (94.6%% of total income)
These contain an average of 1.9 people (1.3 income earners, 0.3 children, and 0.0 seniors)
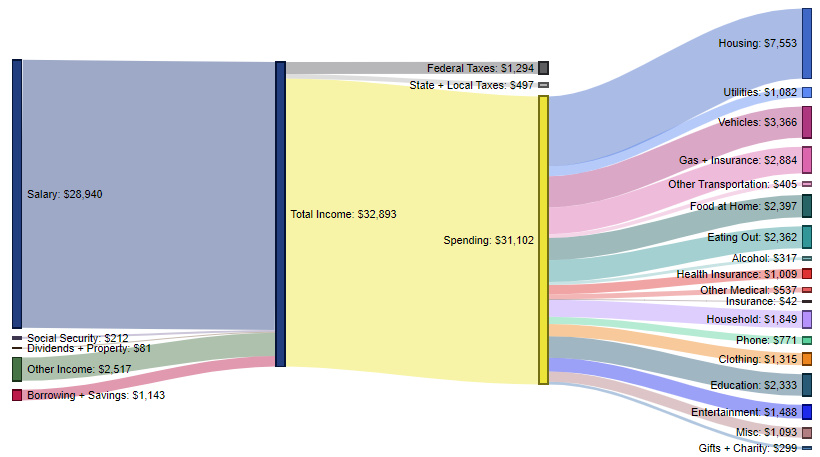
For the average household with a primary resident under 25 years old, total income is $32,893.
The biggest expense is housing (24.3% of spending), followed by vehicles (10.8%), gas and insurance (9.3%), food at home (7.7%), and dining out (7.6%). For this younger cohort, education is also a significant expense at $2,333 per year (7.5% of spending).
Between 25-34 Years – $48,928 in spending (70.8% of total income)
These contain an average of 2.8 people (1.5 income earners, 1.0 children, and 0.0 seniors)
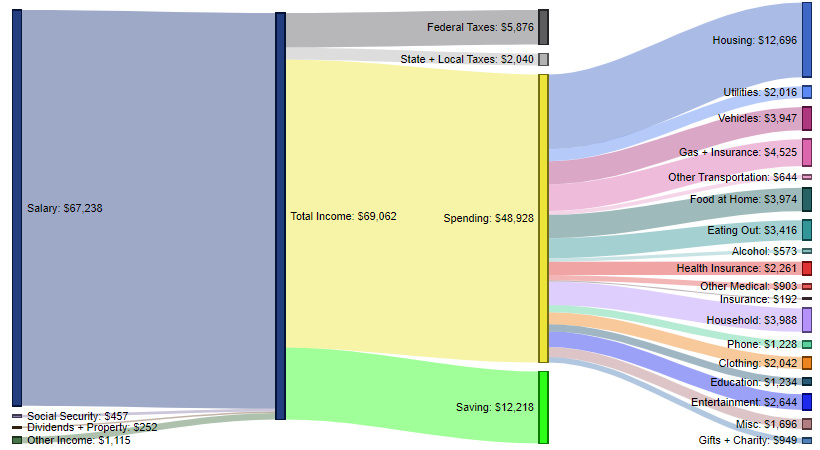
In this age range, earning potential starts to rapidly expand with experience – and households make double that of the previous category (Under 25 years old).
Housing remains the biggest expense (25.9% of spending), followed by gas and insurance (9.2%), household expenses (8.2%), food at home (8.1%), and then vehicles (8.1%).
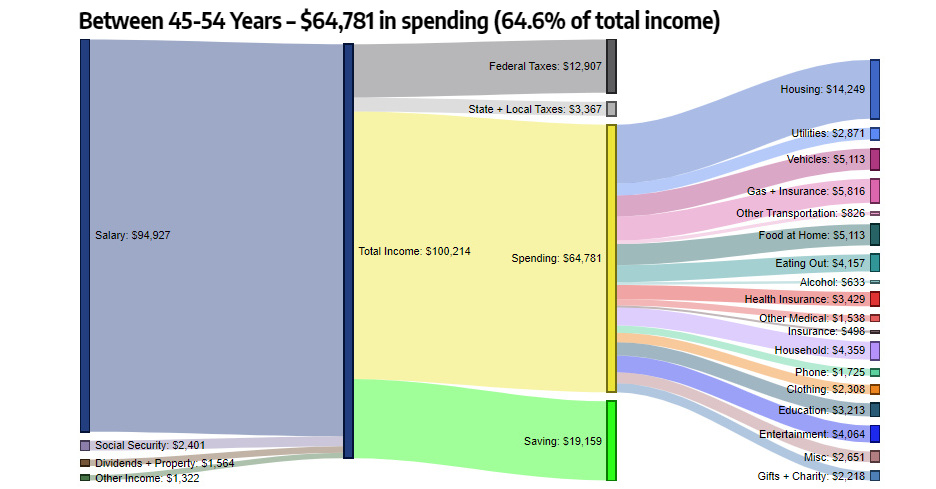
Between 45-54 Years – $64,781 in spending (64.6% of total income)
These contain an average of 2.8 people (1.7 income earners, 0.7 children, and 0.1 seniors)
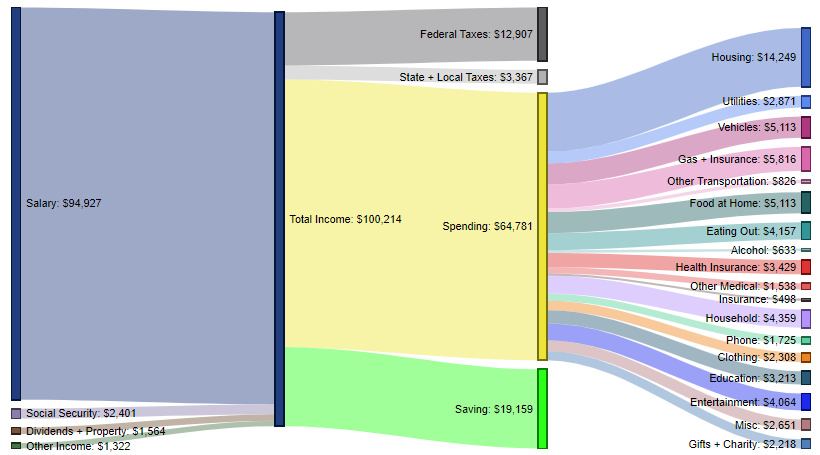
This age range is notable because it has both the highest income and the highest spending. It also represents a time of peak savings, with the average household stashing away $19,159 per year.
Expenses are similar to the previous category. Housing is the biggest expense (22.0%), followed by gas and insurance (9.0%), food at home (7.9%), vehicles (7.9%), and household expenses (6.7%).
Over 75 Years Old – $40,211 in spending (95.6% of total income)
These contain an average of 2.6 people (0.2 income earners, 0.0 children, and 1.4 seniors)
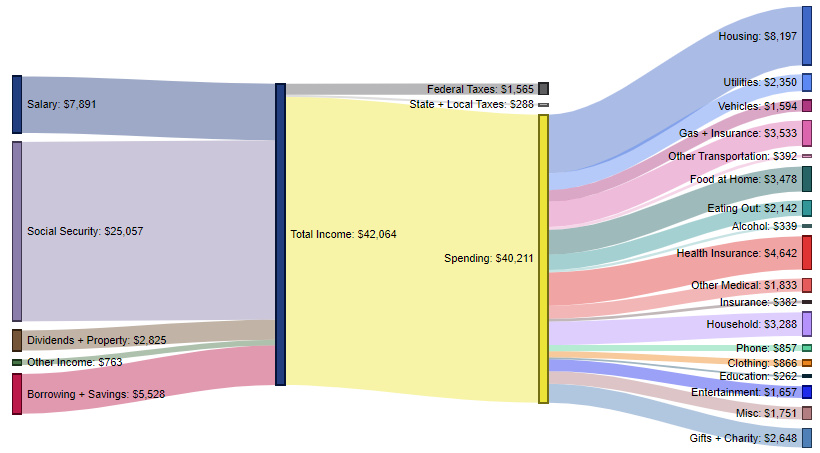
Not surprisingly, here we see salary contributing just $7,891 per year to total income, with social security supplementing income with $25,057 per year.
For this older segment, health insurance (8.2%) jumps up to become the second most important expense. Meanwhile, driving and housing both drop in their respective allocations.
The Typical Earning Arc?
The data confirms that conventional wisdom around the typical earning trajectory for Americans seems pretty accurate.
For more breakdowns, check out how Americans spend their money based on income levels or education levels.
Did you find any surprising anomalies in the numbers?


Money
Charted: Which City Has the Most Billionaires in 2024?
Just two countries account for half of the top 20 cities with the most billionaires. And the majority of the other half are found in Asia.


Charted: Which Country Has the Most Billionaires in 2024?
This was originally posted on our Voronoi app. Download the app for free on iOS or Android and discover incredible data-driven charts from a variety of trusted sources.
Some cities seem to attract the rich. Take New York City for example, which has 340,000 high-net-worth residents with investable assets of more than $1 million.
But there’s a vast difference between being a millionaire and a billionaire. So where do the richest of them all live?
Using data from the Hurun Global Rich List 2024, we rank the top 20 cities with the highest number of billionaires in 2024.
A caveat to these rich lists: sources often vary on figures and exact rankings. For example, in last year’s reports, Forbes had New York as the city with the most billionaires, while the Hurun Global Rich List placed Beijing at the top spot.
Ranked: Top 20 Cities with the Most Billionaires in 2024
The Chinese economy’s doldrums over the course of the past year have affected its ultra-wealthy residents in key cities.
Beijing, the city with the most billionaires in 2023, has not only ceded its spot to New York, but has dropped to #4, overtaken by London and Mumbai.
| Rank | City | Billionaires | Rank Change YoY |
|---|---|---|---|
| 1 | 🇺🇸 New York | 119 | +1 |
| 2 | 🇬🇧 London | 97 | +3 |
| 3 | 🇮🇳 Mumbai | 92 | +4 |
| 4 | 🇨🇳 Beijing | 91 | -3 |
| 5 | 🇨🇳 Shanghai | 87 | -2 |
| 6 | 🇨🇳 Shenzhen | 84 | -2 |
| 7 | 🇭🇰 Hong Kong | 65 | -1 |
| 8 | 🇷🇺 Moscow | 59 | No Change |
| 9 | 🇮🇳 New Delhi | 57 | +6 |
| 10 | 🇺🇸 San Francisco | 52 | No Change |
| 11 | 🇹🇭 Bangkok | 49 | +2 |
| 12 | 🇹🇼 Taipei | 45 | +2 |
| 13 | 🇫🇷 Paris | 44 | -2 |
| 14 | 🇨🇳 Hangzhou | 43 | -5 |
| 15 | 🇸🇬 Singapore | 42 | New to Top 20 |
| 16 | 🇨🇳 Guangzhou | 39 | -4 |
| 17T | 🇮🇩 Jakarta | 37 | +1 |
| 17T | 🇧🇷 Sao Paulo | 37 | No Change |
| 19T | 🇺🇸 Los Angeles | 31 | No Change |
| 19T | 🇰🇷 Seoul | 31 | -3 |
In fact all Chinese cities on the top 20 list have lost billionaires between 2023–24. Consequently, they’ve all lost ranking spots as well, with Hangzhou seeing the biggest slide (-5) in the top 20.
Where China lost, all other Asian cities—except Seoul—in the top 20 have gained ranks. Indian cities lead the way, with New Delhi (+6) and Mumbai (+3) having climbed the most.
At a country level, China and the U.S combine to make up half of the cities in the top 20. They are also home to about half of the world’s 3,200 billionaire population.
In other news of note: Hurun officially counts Taylor Swift as a billionaire, estimating her net worth at $1.2 billion.

-

 Mining1 week ago
Gold vs. S&P 500: Which Has Grown More Over Five Years?
-

 Markets2 weeks ago
Ranked: The Most Valuable Housing Markets in America
-

 Money2 weeks ago
Which States Have the Highest Minimum Wage in America?
-

 AI2 weeks ago
Ranked: Semiconductor Companies by Industry Revenue Share
-

 Markets2 weeks ago
Ranked: The World’s Top Flight Routes, by Revenue
-

 Countries2 weeks ago
Population Projections: The World’s 6 Largest Countries in 2075
-

 Markets2 weeks ago
The Top 10 States by Real GDP Growth in 2023
-

 Demographics2 weeks ago
The Smallest Gender Wage Gaps in OECD Countries