Misc
Visualized: Who Americans Spend Their Time With
Who Americans Spend Their Time With
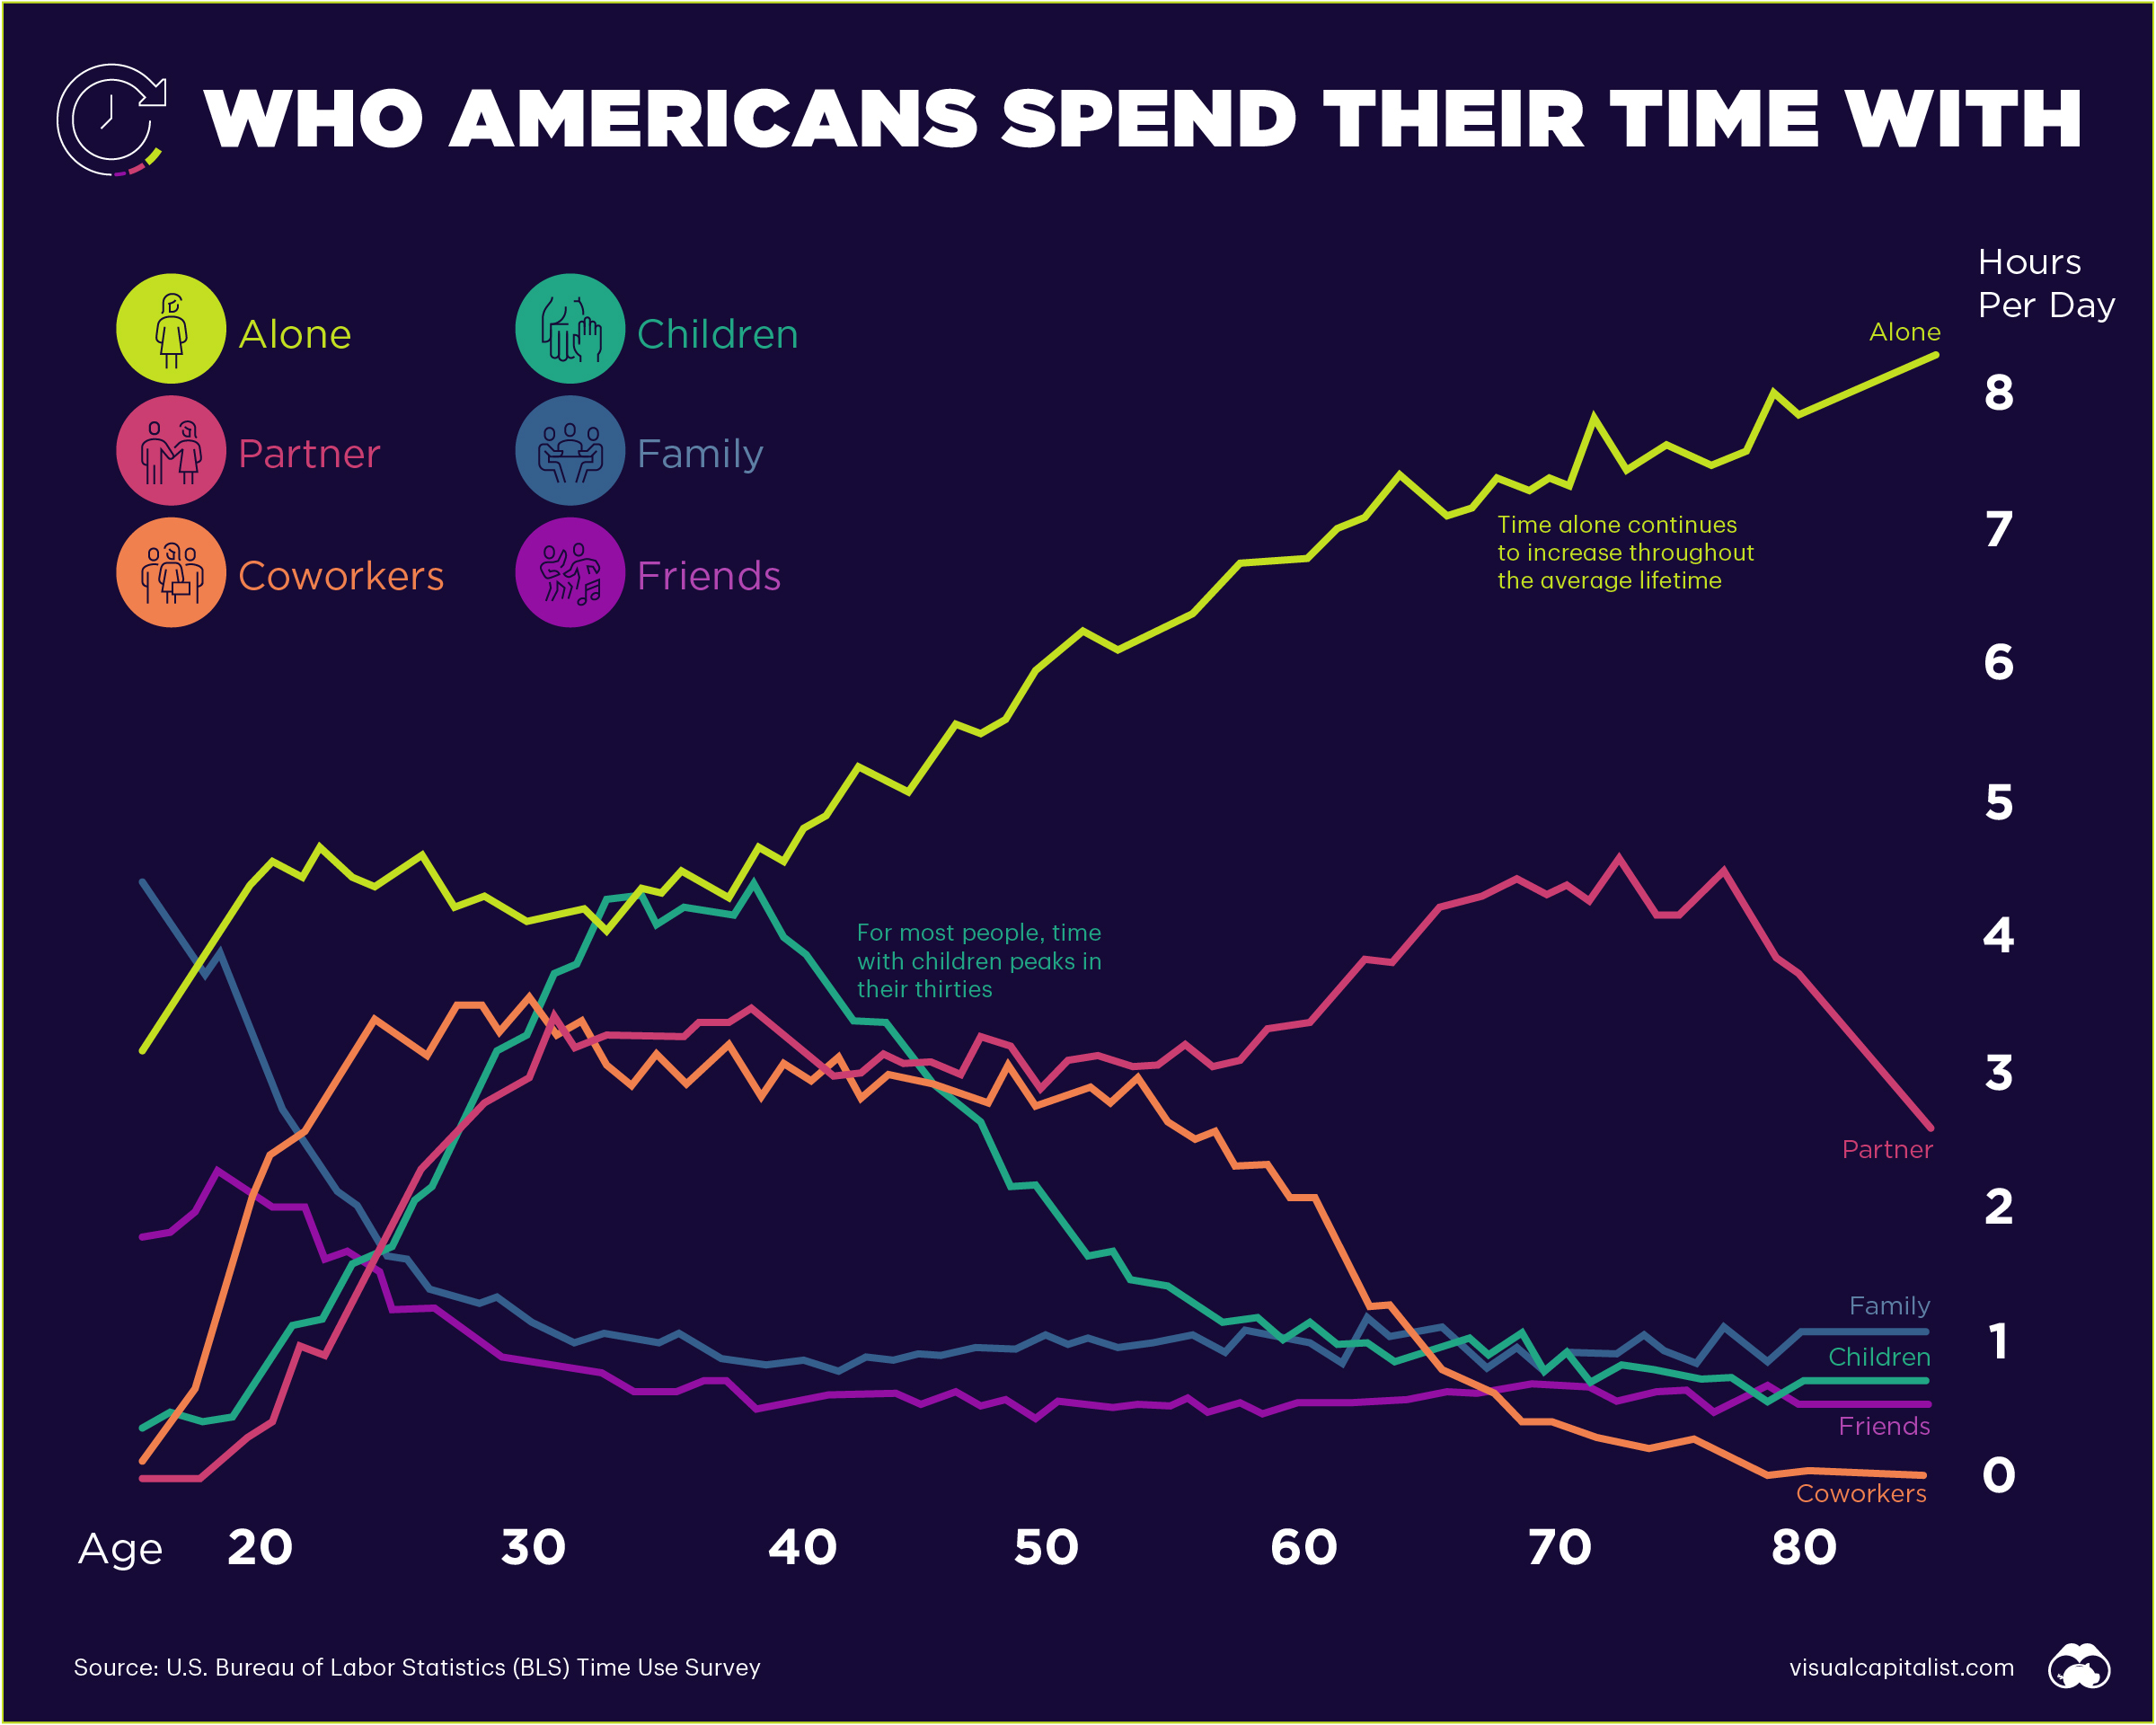
Throughout history, humans have relied on cooperation and social relationships to thrive. Of course, who we spend time with evolves throughout our lifetime.
Using insights from the American Time Use Survey and Our World in Data, we look at who Americans spend the most time with at various ages of their life.
Adolescence to Adulthood
In the average Americanโs teenage years, they spend most of their time alone and with their family. This makes sense, as the majority of people under 18 still live in a home with their nuclear family unit, meaning parents and siblings. Not surprisingly, adolescence is also when time spent with friends reaches its peak.
Jumping forward to a person’s early adulthood, 25-year-olds spend an average of 275 minutes per day alone, and 199 minutes with coworkers. This aligns with people in their twenties beginning to enter the workforce.
By age 35, people are still spending the most time with themselves, at 263 minutes per day. However, time spent combined with children and partners, the runner-ups, adds up to 450 minutes or around 7.5 hours a day.
Age | Most Time Spent | Second | Third |
---|---|---|---|
15 | Family - 267 Minutes | Alone - 193 Minutes | Friends - 109 Minutes |
25 | Alone - 275 Minutes | Coworkers - 199 Minutes | Partner - 121 Minutes |
35 | Alone - 263 Minutes | Children - 249 Minutes | Partner - 198 Minutes |
Although people are spending more time with kids and partners as they grow older, this trend may shift, as women are having fewer children. More women today are obtaining an education and are entering the workforce, causing them to delay or entirely put off having children.
Middle to Old Age
Upon turning 45, the average person spends 309 minutes a day alone, and in second place, 199 minutes with children. Time with coworkers remains relatively steady throughout someoneโs forties, which coincides with the middle of career for most people in the workforce.
By age 55, time spent alone still takes top spot, but time spent with a partner goes up to 184 minutes, and time with coworkers also moves up, pushing out time spent with children.
Age | Most Time Spent | Second | Third |
---|---|---|---|
45 | Alone - 309 Minutes | Children - 199 Minutes | Partner - 184 Minutes |
55 | Alone - 384 Minutes | Partner - 184 Minutes | Coworkers - 163 Minutes |
65 | Alone - 444 Minutes | Partner - 243 Minutes | Family - 65 Minutes |
75 | Alone - 463 Minutes | Partner - 253 Minutes | Family - 56 Minutes |
Typically, time spent with children during the mid-fifties tends to see a sharp decline as children enter adulthood and begin to move out or spend more time out of the house.
Today, more children are staying at home longer or even moving back home. 52% of adult children in the U.S. today are living with their parents.
As people get closer to old age, around 65-years-old, they spend increasingly less time with coworkers as they begin to retire, and much more time alone or with a spouse. Then, from age 65-75, people consistently spend the most time alone, then with a partner and family.
Alone and Lonely?
One of the most significant trends on the chart is increased time spent alone.
By the time someone reaches 80, their daily minutes alone goes up to 477. This can be a problematic reality. As the population continues to age in many countries around the world, more elderly people are left without resources or social connection.
Additionally, while one quarter of elderly Americans live alone, the trend of solo living is going up across nearly every age group, and this trend applies to a number of mature economies around the world.
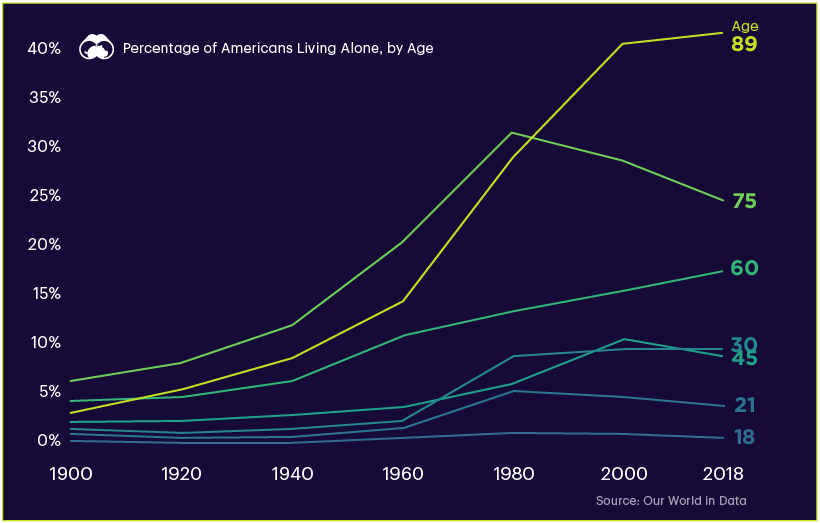
A natural conclusion would be that increasing alone time has negative impacts on people, however, being alone does not necessarily equate to loneliness. Our World in Data found that there was no direct correlation between living alone and reported feelings of loneliness.
One final consideration is the role technology plays in our social interactions. Thanks to smartphones and social platforms, time alone doesn’t necessarily equal isolation.
It is not just the amount of time spent with others, but the quality and expectations, that reduce loneliness.
Where does this data come from?
Source: U.S. Bureau of Labor Statistics American Time Use Survey, accessed on Our World in Data.
Notes: While respondents to the Time Use Survey are tracking their activity, they indicate who was present during each activity recorded. This results in the data used in this article. It’s worth noting that individuals can be counted twice, since people from various categories can be present at the same time.
Maps
Interactive: Comparing Military Spend Around the World
Which countries have the highest military spend relative to their economy? This visual breaks down the amount spent in each country by GDP.

Comparing Military Spend Around the World
One of the easiest ways to identify a nationโs priorities is by tracking its expenditures, and military spend is no different.
Usually spending is measured, and ranked, in absolute amounts. For example, countries around the world collectively spent $2.1 trillion on their militaries in 2021, with the most coming from the U.S. ($800 billion), China ($293 billion), and India ($77 billion).
But these eye-popping figures are best understood in the context of each country’s economy. Using data from the Stockholm International Peace Research Institute (SIPRI), Varun Jain has visualized 158 countries’ military expenditures, both as a percentage of their total GDP as well as in average per-capita spend.
Countriesโ Military Spend as a Percentage of their Economy
To begin, Jain identified three categories of military expenditure as a percent of GDP, using the five-year (2018โ2022) average for more consistent data:
Military Spend | % of GDP | Countries |
---|---|---|
High | Above 5% | 7 |
Medium | 2โ5% | 44 |
Low | Below 2% | 107 |
Under this categorization, the stand outs are the countries spending an outsized amount of their economic output on military, rather than the highest total spenders in absolute terms.
At the top of the table is Ukraine, which has earmarked a staggering average of 9.46% of its total economic output on defense over the past five years. That’s well ahead of second-place Saudi Arabia, which is slightly above 8%.
In Ukraine’s case, its high ranking shows how quickly priorities can change. From 2018 to 2021, the country spent 3.2-3.8% of its GDP on its military, but the outbreak of war with Russia saw its expenditures jump to one-third of economic output.
Other countries from the Middle East and North Africa follow in this tier, with Oman third at 8.11% and Qatar fourth with 5.88%. Rounding out the top seven high spenders are Algeria, Kuwait, and Israel.
Rank | Country | Military Spend | % of GDP |
---|---|---|---|
1 | ๐บ๐ฆ Ukraine | High | 9.46% |
2 | ๐ธ๐ฆ Saudi Arabia | High | 8.19% |
3 | ๐ด๐ฒ Oman | High | 8.11% |
4 | ๐ถ๐ฆ Qatar | High | 5.88% |
5 | ๐ฉ๐ฟ Algeria | High | 5.70% |
6 | ๐ฐ๐ผ Kuwait | High | 5.66% |
7 | ๐ฎ๐ฑ Israel | High | 5.09% |
8 | ๐ฏ๐ด Jordan | Medium | 4.81% |
9 | ๐ฆ๐ฒ Armenia | Medium | 4.53% |
10 | ๐ฆ๐ฟ Azerbaijan | Medium | 4.53% |
11 | ๐ฑ๐ง Lebanon | Medium | 4.01% |
12 | ๐ท๐บ Russia | Medium | 3.98% |
13 | ๐ง๐ญ Bahrain | Medium | 3.79% |
14 | ๐ต๐ฐ Pakistan | Medium | 3.75% |
15 | ๐ฒ๐ฆ Morocco | Medium | 3.72% |
16 | ๐บ๐ฟ Uzbekistan | Medium | 3.56% |
17 | ๐บ๐ธ U.S. | Medium | 3.48% |
18 | ๐จ๐ด Colombia | Medium | 3.24% |
19 | ๐ฌ๐ท Greece | Medium | 3.15% |
20 | ๐ณ๐ฆ Namibia | Medium | 3.09% |
21 | ๐ง๐ณ Brunei | Medium | 3.09% |
22 | ๐ธ๐ธ South Sudan | Medium | 3.05% |
23 | ๐น๐ฌ Togo | Medium | 3.03% |
24 | ๐ฒ๐ฑ Mali | Medium | 2.90% |
25 | ๐จ๐บ Cuba | Medium | 2.88% |
26 | ๐ธ๐ฌ Singapore | Medium | 2.86% |
27 | ๐ง๐ผ Botswana | Medium | 2.86% |
28 | ๐ฒ๐ฒ Myanmar | Medium | 2.76% |
29 | ๐ง๐ซ Burkina Faso | Medium | 2.70% |
30 | ๐ฎ๐ถ Iraq | Medium | 2.69% |
31 | ๐ฐ๐ท South Korea | Medium | 2.69% |
32 | ๐จ๐ฌ Republic of Congo | Medium | 2.68% |
33 | ๐น๐ฉ Chad | Medium | 2.66% |
34 | ๐ฎ๐ณ India | Medium | 2.58% |
35 | ๐น๐ณ Tunisia | Medium | 2.58% |
36 | ๐ช๐จ Ecuador | Medium | 2.34% |
37 | ๐ฎ๐ท Iran | Medium | 2.32% |
38 | ๐ป๐ณ Viet Nam | Medium | 2.28% |
39 | ๐ฐ๐ญ Cambodia | Medium | 2.26% |
40 | ๐ฒ๐ท Mauritania | Medium | 2.24% |
41 | ๐ณ๐ช Niger | Medium | 2.21% |
42 | ๐ง๐ฎ Burundi | Medium | 2.21% |
43 | ๐น๐ท Turkey | Medium | 2.19% |
44 | ๐ต๐ฑ Poland | Medium | 2.17% |
45 | ๐ฑ๐ป Latvia | Medium | 2.14% |
46 | ๐ฑ๐น Lithuania | Medium | 2.13% |
47 | ๐ช๐ช Estonia | Medium | 2.13% |
48 | ๐ฌ๐ง United Kingdom | Medium | 2.12% |
49 | ๐บ๐พ Uruguay | Medium | 2.11% |
50 | ๐ท๐ธ Serbia | Medium | 2.06% |
51 | ๐บ๐ฌ Uganda | Medium | 2.02% |
52 | ๐ญ๐ท Croatia | Low | 1.97% |
53 | ๐ฆ๐บ Australia | Low | 1.93% |
54 | ๐จ๐ฑ Chile | Low | 1.92% |
55 | ๐ซ๐ท France | Low | 1.91% |
56 | ๐จ๐พ Cyprus | Low | 1.90% |
57 | ๐ท๐ด Romania | Low | 1.87% |
58 | ๐ง๐ฌ Bulgaria | Low | 1.85% |
59 | ๐ธ๐ฟ Eswatini | Low | 1.82% |
60 | ๐ณ๐ด Norway | Low | 1.81% |
61 | ๐จ๐ซ Central African Republic | Low | 1.78% |
62 | ๐ฑ๐ฐ Sri Lanka | Low | 1.77% |
63 | ๐ต๐น Portugal | Low | 1.77% |
64 | ๐น๐ผ Taiwan | Low | 1.76% |
65 | ๐จ๐ณ China | Low | 1.72% |
66 | ๐ฌ๐ช Georgia | Low | 1.71% |
67 | ๐ธ๐ฐ Slovakia | Low | 1.67% |
68 | ๐ฌ๐ผ Guinea-Bissau | Low | 1.65% |
69 | ๐ฐ๐ฌ Kyrgyzstan | Low | 1.62% |
70 | ๐ฌ๐ณ Guinea | Low | 1.61% |
71 | ๐ซ๐ฎ Finland | Low | 1.60% |
72 | ๐ธ๐ณ Senegal | Low | 1.58% |
73 | ๐ญ๐ณ Honduras | Low | 1.56% |
74 | ๐ฌ๐ฆ Gabon | Low | 1.56% |
75 | ๐ฒ๐ฟ Mozambique | Low | 1.56% |
76 | ๐ฑ๐ธ Lesotho | Low | 1.56% |
77 | ๐ฒ๐ช Montenegro | Low | 1.54% |
78 | ๐ซ๐ฏ Fiji | Low | 1.54% |
79 | ๐ฏ๐ฒ Jamaica | Low | 1.49% |
80 | ๐ฆ๐ด Angola | Low | 1.48% |
81 | ๐ฎ๐น Italy | Low | 1.48% |
82 | ๐ญ๐บ Hungary | Low | 1.48% |
83 | ๐ง๐ด Bolivia | Low | 1.46% |
84 | ๐ธ๐จ Seychelles | Low | 1.43% |
85 | ๐ณ๐ฑ Netherlands | Low | 1.41% |
86 | ๐ธ๐ฉ Sudan | Low | 1.39% |
87 | ๐ท๐ผ Rwanda | Low | 1.39% |
88 | ๐ณ๐ต Nepal | Low | 1.36% |
89 | ๐ฉ๐ฐ Denmark | Low | 1.36% |
90 | ๐ฆ๐ฑ Albania | Low | 1.34% |
91 | ๐ช๐ธ Spain | Low | 1.34% |
92 | ๐น๐ญ Thailand | Low | 1.33% |
93 | ๐ฆ๐ซ Afghanistan | Low | 1.33% |
94 | ๐ณ๐ฟ New Zealand | Low | 1.32% |
95 | ๐จ๐ฆ Canada | Low | 1.32% |
96 | ๐ฉ๐ช Germany | Low | 1.31% |
97 | ๐ฒ๐ฐ North Macedonia | Low | 1.30% |
98 | ๐ง๐ท Brazil | Low | 1.29% |
99 | ๐ง๐ฟ Belize | Low | 1.28% |
100 | ๐ธ๐ป El Salvador | Low | 1.28% |
101 | ๐ง๐ฉ Bangladesh | Low | 1.26% |
102 | ๐ฟ๐ฒ Zambia | Low | 1.25% |
103 | ๐ฌ๐ถ Equatorial Guinea | Low | 1.24% |
104 | ๐ฌ๐พ Guyana | Low | 1.22% |
105 | ๐จ๐ฎ Cote d'Ivoire | Low | 1.22% |
106 | ๐ช๐ฌ Egypt | Low | 1.20% |
107 | ๐ต๐ช Peru | Low | 1.20% |
108 | ๐ง๐พ Belarus | Low | 1.18% |
109 | ๐ธ๐ช Sweden | Low | 1.17% |
110 | ๐ฐ๐ช Kenya | Low | 1.13% |
111 | ๐ธ๐ฎ Slovenia | Low | 1.10% |
112 | ๐น๐ฑ Timor Leste | Low | 1.08% |
113 | ๐น๐ฟ Tanzania | Low | 1.05% |
114 | ๐จ๐ฒ Cameroon | Low | 1.04% |
115 | ๐น๐ฏ Tajikistan | Low | 1.03% |
116 | ๐ฏ๐ต Japan | Low | 1.03% |
117 | ๐ง๐ช Belgium | Low | 1.02% |
118 | ๐ฑ๐ท Liberia | Low | 1.00% |
119 | ๐ฒ๐พ Malaysia | Low | 0.98% |
120 | ๐ต๐ญ Philippines | Low | 0.96% |
121 | ๐ต๐พ Paraguay | Low | 0.95% |
122 | ๐ฝ๐ฐ Kosovo | Low | 0.95% |
123 | ๐ฟ๐ฆ South Africa | Low | 0.94% |
124 | ๐ฒ๐ผ Malawi | Low | 0.92% |
125 | ๐ง๐ฆ Bosnia and Herzegovina | Low | 0.84% |
126 | ๐ฐ๐ฟ Kazakhstan | Low | 0.83% |
127 | ๐ฆ๐น Austria | Low | 0.78% |
128 | ๐ฌ๐ฒ Gambia | Low | 0.76% |
129 | ๐น๐น Trinidad & Tobago | Low | 0.75% |
130 | ๐ฎ๐ฉ Indonesia | Low | 0.74% |
131 | ๐จ๐ญ Switzerland | Low | 0.73% |
132 | ๐จ๐ฟ Czech Republic | Low | 0.71% |
133 | ๐ฉ๐ด Dominican Republic | Low | 0.70% |
134 | ๐ฒ๐ณ Mongolia | Low | 0.69% |
135 | ๐ฒ๐ฌ Madagascar | Low | 0.68% |
136 | ๐จ๐ฉ Dem. Rep. of Congo | Low | 0.64% |
137 | ๐ณ๐ฌ Nigeria | Low | 0.64% |
138 | ๐ช๐น Ethiopia | Low | 0.64% |
139 | ๐ธ๐ฑ Sierra Leone | Low | 0.64% |
140 | ๐ฆ๐ท Argentina | Low | 0.63% |
141 | ๐ฑ๐บ Luxembourg | Low | 0.61% |
142 | ๐ฒ๐ฝ Mexico | Low | 0.61% |
143 | ๐ณ๐ฎ Nicaragua | Low | 0.60% |
144 | ๐จ๐ป Cape Verde | Low | 0.54% |
145 | ๐ง๐ฏ Benin | Low | 0.54% |
146 | ๐ฒ๐น Malta | Low | 0.48% |
147 | ๐ฌ๐น Guatemala | Low | 0.45% |
148 | ๐ฌ๐ญ Ghana | Low | 0.43% |
149 | ๐ต๐ฌ Papua New Guinea | Low | 0.38% |
150 | ๐ฒ๐ฉ Moldova | Low | 0.36% |
151 | ๐ฎ๐ช Ireland | Low | 0.27% |
152 | ๐ฟ๐ผ Zimbabwe | Low | 0.26% |
153 | ๐ป๐ช Venezuela | Low | 0.20% |
154 | ๐ญ๐น Haiti | Low | 0.17% |
155 | ๐ฒ๐บ Mauritius | Low | 0.16% |
156 | ๐จ๐ท Costa Rica | Low | 0.00% |
157 | ๐ฎ๐ธ Iceland | Low | 0.00% |
158 | ๐ต๐ฆ Panama | Low | 0.00% |
The medium group consists of 44 countries and is led by four nations (Jordan, Armenia, Azerbaijan, and Lebanon) that all spend more than 4% of their GDP on their militaries. Other familiar countries known to have large military budgets, like Russia, Pakistan, the U.S., India and the UK, are also in this category.
The low spend group has a total of 107 countries, but also contains some surprises. For example, China, France, and Germanyโall in the top 10 countries by absolute military spendโactually have similar amounts of military spend as a percent of GDP as Georgia, Cyprus, and North Macedonia respectively.
At the bottom of the table are countries with either low military importance, or strange technicalities. For example, Mauritius is one of the countries with the lowest military budgets because it doesn’t officially have a standing military, instead relying on two paramilitary forces (a special mobile force and a Coast Guard).
Similarly, Iceland allocates 0% of its GDP towards military spending. In place of a standing army, the country maintains a specialized peacekeeping force, a substantial Coast Guard, and relies on security alliances within NATO, of which it is a member and provides financial support to.
Ranking Defense Spending Per Capita
While the measure above equalizes military spend on economic strength, per-capita military spending shows how much countries allocate while accounting for population size.
On a per-capita basis (again using a five-year average), Qatar leads the ranks with a per-capita spend of $4,564, well-ahead of Israel at $2,535, and Saudi Arabia at $1,928.
Rank | Country | Per Capita Spend ($) |
---|---|---|
1 | ๐ถ๐ฆ Qatar | $4,564 |
2 | ๐ฎ๐ฑ Israel | $2,535 |
3 | ๐ธ๐ฆ Saudi Arabia | $1,928 |
4 | ๐ธ๐ฌ Singapore | $1,837 |
5 | ๐ฐ๐ผ Kuwait | $1,815 |
6 | ๐บ๐ธ U.S. | $1,815 |
7 | ๐ณ๐ด Norway | $1,438 |
8 | ๐ด๐ฒ Oman | $1,254 |
9 | ๐ฆ๐บ Australia | $1,131 |
10 | ๐ง๐ณ Brunei | $959 |
11 | ๐ฌ๐ง UK | $913 |
12 | ๐ฐ๐ท South Korea | $894 |
13 | ๐ง๐ญ Bahrain | $863 |
14 | ๐ฉ๐ฐ Denmark | $861 |
15 | ๐ซ๐ท France | $811 |
16 | ๐ซ๐ฎ Finland | $801 |
17 | ๐ณ๐ฑ Netherlands | $765 |
18 | ๐ฑ๐บ Luxembourg | $694 |
19 | ๐ธ๐ช Sweden | $662 |
20 | ๐จ๐ญ Switzerland | $647 |
21 | ๐จ๐ฆ Canada | $645 |
22 | ๐ฌ๐ท Greece | $629 |
23 | ๐ฉ๐ช Germany | $623 |
24 | ๐ณ๐ฟ New Zealand | $610 |
25 | ๐ช๐ช Estonia | $535 |
26 | ๐น๐ผ Taiwan | $495 |
27 | ๐ฎ๐น Italy | $494 |
28 | ๐ง๐ช Belgium | $487 |
29 | ๐ท๐บ Russia | $467 |
30 | ๐ฑ๐น Lithuania | $463 |
31 | ๐ต๐น Portugal | $417 |
32 | ๐ฑ๐ป Latvia | $405 |
33 | ๐จ๐พ Cyprus | $399 |
34 | ๐ฏ๐ต Japan | $398 |
35 | ๐ช๐ธ Spain | $395 |
36 | ๐ฆ๐น Austria | $393 |
37 | ๐ต๐ฑ Poland | $359 |
38 | ๐บ๐พ Uruguay | $354 |
39 | ๐ธ๐ฐ Slovakia | $334 |
40 | ๐ฑ๐ง Lebanon | $334 |
41 | ๐ธ๐ฎ Slovenia | $302 |
42 | ๐บ๐ฆ Ukraine | $302 |
43 | ๐ญ๐ท Croatia | $294 |
44 | ๐จ๐ฑ Chile | $292 |
45 | ๐ท๐ด Romania | $258 |
46 | ๐ญ๐บ Hungary | $248 |
47 | ๐ฎ๐ช Ireland | $235 |
48 | ๐ธ๐จ Seychelles | $230 |
49 | ๐ฆ๐ฟ Azerbaijan | $226 |
50 | ๐ฉ๐ฟ Algeria | $219 |
51 | ๐ฆ๐ฒ Armenia | $217 |
52 | ๐ง๐ผ Botswana | $215 |
53 | ๐ฏ๐ด Jordan | $207 |
54 | ๐น๐ท Turkey | $199 |
55 | ๐จ๐ด Colombia | $197 |
56 | ๐ง๐ฌ Bulgaria | $194 |
57 | ๐จ๐ณ China | $183 |
58 | ๐ฒ๐น Malta | $175 |
59 | ๐จ๐ฟ Czech Republic | $175 |
60 | ๐ฎ๐ท Iran | $169 |
61 | ๐ณ๐ฆ Namibia | $159 |
62 | ๐ฎ๐ถ Iraq | $145 |
63 | ๐ช๐จ Ecuador | $138 |
64 | ๐ฒ๐ช Montenegro | $137 |
65 | ๐ท๐ธ Serbia | $133 |
66 | ๐น๐น Trinidad & Tobago | $131 |
67 | ๐ฌ๐ฆ Gabon | $124 |
68 | ๐ฒ๐ฆ Morocco | $122 |
69 | ๐ฌ๐ถ Equatorial Guinea | $112 |
70 | ๐ฒ๐พ Malaysia | $109 |
71 | ๐ง๐ท Brazil | $107 |
72 | ๐น๐ญ Thailand | $97 |
73 | ๐ฌ๐พ Guyana | $92 |
74 | ๐น๐ณ Tunisia | $91 |
75 | ๐ซ๐ฏ Fiji | $83 |
76 | ๐ฒ๐ฐ North Macedonia | $83 |
77 | ๐ฐ๐ฟ Kazakhstan | $82 |
78 | ๐ต๐ช Peru | $81 |
79 | ๐ฌ๐ช Georgia | $80 |
80 | ๐ง๐พ Belarus | $80 |
81 | ๐ฏ๐ฒ Jamaica | $77 |
82 | ๐ฆ๐ฑ Albania | $76 |
83 | ๐ธ๐ฟ Eswatini | $72 |
84 | ๐ฑ๐ฐ Sri Lanka | $69 |
85 | ๐ฆ๐ท Argentina | $66 |
86 | ๐ง๐ฟ Belize | $60 |
87 | ๐ฒ๐ฝ Mexico | $59 |
88 | ๐ฉ๐ด Dominican Republic | $58 |
89 | ๐ป๐ณ Viet Nam | $58 |
90 | ๐ฟ๐ฆ South Africa | $56 |
91 | ๐ธ๐ป El Salvador | $54 |
92 | ๐ง๐ฆ Bosnia and Herzegovina | $54 |
93 | ๐ฎ๐ณ India | $53 |
94 | ๐จ๐ฌ Republic of Congo | $53 |
95 | ๐ต๐พ Paraguay | $52 |
96 | ๐ง๐ด Bolivia | $51 |
97 | ๐ต๐ฐ Pakistan | $49 |
98 | ๐บ๐ฟ Uzbekistan | $44 |
99 | ๐ฆ๐ด Angola | $43 |
100 | ๐ฝ๐ฐ Kosovo | $42 |
101 | ๐ฒ๐ท Mauritania | $42 |
102 | ๐ญ๐ณ Honduras | $42 |
103 | ๐ช๐ฌ Egypt | $41 |
104 | ๐ฐ๐ญ Cambodia | $36 |
105 | ๐ฒ๐ฒ Myanmar | $35 |
106 | ๐ต๐ญ Philippines | $33 |
107 | ๐ฒ๐ณ Mongolia | $33 |
108 | ๐ฎ๐ฉ Indonesia | $31 |
109 | ๐ง๐ฉ Bangladesh | $27 |
110 | ๐น๐ฑ Timor Leste | $27 |
111 | ๐ฒ๐ฑ Mali | $26 |
112 | ๐ธ๐ณ Senegal | $24 |
113 | ๐จ๐ฎ Cote d'Ivoire | $23 |
114 | ๐น๐ฌ Togo | $21 |
115 | ๐ฐ๐ช Kenya | $21 |
116 | ๐ฐ๐ฌ Kyrgyzstan | $20 |
117 | ๐ง๐ซ Burkina Faso | $20 |
118 | ๐ฌ๐ณ Guinea | $19 |
119 | ๐ฑ๐ธ Lesotho | $19 |
120 | ๐จ๐ป Cape Verde | $19 |
121 | ๐ฌ๐น Guatemala | $19 |
122 | ๐น๐ฉ Chad | $18 |
123 | ๐ธ๐ธ South Sudan | $18 |
124 | ๐ธ๐ฉ Sudan | $18 |
125 | ๐บ๐ฌ Uganda | $18 |
126 | ๐ฟ๐ผ Zimbabwe | $17 |
127 | ๐ฟ๐ฒ Zambia | $16 |
128 | ๐ฒ๐บ Mauritius | $16 |
129 | ๐จ๐ฒ Cameroon | $16 |
130 | ๐ณ๐ต Nepal | $15 |
131 | ๐ณ๐ฌ Nigeria | $14 |
132 | ๐ณ๐ฎ Nicaragua | $12 |
133 | ๐ฌ๐ผ Guinea-Bissau | $12 |
134 | ๐น๐ฟ Tanzania | $12 |
135 | ๐จ๐บ Cuba | $11 |
136 | ๐ท๐ผ Rwanda | $11 |
137 | ๐ฒ๐ฉ Moldova | $11 |
138 | ๐ต๐ฌ Papua New Guinea | $10 |
139 | ๐ณ๐ช Niger | $10 |
140 | ๐น๐ฏ Tajikistan | $9 |
141 | ๐จ๐ซ Central African Republic | $8 |
142 | ๐ฒ๐ฟ Mozambique | $8 |
143 | ๐ฌ๐ญ Ghana | $8 |
144 | ๐ง๐ฏ Benin | $7 |
145 | ๐ง๐ฎ Burundi | $7 |
146 | ๐ฆ๐ซ Afghanistan | $6 |
147 | ๐ฌ๐ฒ Gambia | $6 |
148 | ๐ช๐น Ethiopia | $5 |
149 | ๐ป๐ช Venezuela | $5 |
150 | ๐ฒ๐ผ Malawi | $4 |
151 | ๐ธ๐ฑ Sierra Leone | $3 |
152 | ๐ฒ๐ฌ Madagascar | $3 |
153 | ๐จ๐ฉ Dem. Rep. of Congo | $3 |
154 | ๐ฑ๐ท Liberia | $3 |
155 | ๐ญ๐น Haiti | $2 |
156 | ๐จ๐ท Costa Rica | $0 |
157 | ๐ฎ๐ธ Iceland | $0 |
158 | ๐ต๐ฆ Panama | $0 |
Measured this way, we get a perspective of how small defense budgets can be per person, even if the total expenditure is large.
For example, India has the fourth-highest total defense expenditure in 2022, but because of its massive population only sets aside $53 per resident for its military, putting it solidly at the bottom third of the per-capita rankings.
Patterns Revealed By Measuring Military Spend
Changing how we look at a countryโs military budget can reveal a lot more than just looking at absolute numbers.
For example, the Middle East is the region with the highest spenders on defense as a percentage of their GDP, giving us insight into regional security concerns.
Countries from the medium group of military spendingโincluding parts of Eastern Europe, sub-Saharan Africa, and South Asiaโhighlight past or recent conflict zones between neighbors, countries with internal strife, or countries wary of a regional aggressor. Ukraine’s average per capita military spend, for example, was just $122.4 from 2018 to 2021. The next year, it jumped nearly 10 times to $1,018.66 per person after Russia’s invasion.
In fact, European military spending saw its sharpest one-year jump in 30 years as a direct result of the war.
Alongside European anxieties, ongoing tension between China and Taiwan has also contributed to increased military spending in Asia and Oceania. Will these budgets continue their dramatic ascent or will they rise evenly alongside their relative economies in 2023?
Data note: For these comparisons, the creator is calculating five-year averages (using data from 2018-2022) for military spending as a percentage of GDP and per-capita military spending for each country. The military expenditure data is pulled from Stockholm International Peace Research Institute.
Data for some countries is missing or may vary significantly from official figures. Countries with up to
two years of missing data had averages calculated on the years available, while countries with three or more years of missing data have been removed from this dataset, including: Djibouti, Eritrea, North Korea, Laos, Libya, Somalia, Syria, Turkmenistan, UAE, and Yemen.
Please see SIPRI’s methodologies page for more details on how they collect their data and create estimates.
-
Announcement2 weeks ago
Join Us For Data Creator Con 2023
-
Datastream1 day ago
The 10 Longest Range EVs for 2023
-
Central Banks2 weeks ago
Charted: Public Trust in the Federal Reserve
-
AI2 weeks ago
Ranked: The World’s Top 25 Websites in 2023
-
Cities4 weeks ago
Ranked: Top 10 Cities Where International Travelers Spend the Most
-
AI2 weeks ago
Visualizing the Top U.S. States for AI Jobs
-
VC+4 weeks ago
Coming Soon: Here’s What’s Coming to VC+ Next
-
Maps1 week ago
Mapped: Renewable Energy and Battery Installations in the U.S. in 2023