China
Visualizing Global Shipping Container Traffic
Visualizing Global Shipping Container Traffic
Globalization owes a lot to the humble shipping container.
In the distant past, loading a ship was a complicated affair involving pallets, crates, and winches. This process was labor-intensive and expensive, meaning most goods were simply not worth shipping overseas.
In the 1970s, the standardized shipping container solved this problem on a wide scale and turned the world economy on its head. This standardization drove the cost of shipping down as the efficiency of ports skyrocketed. Modern ports can now move upwards of 70 containers per crane per hour.
It doesn’t matter anymore where you produce something now, because transport costs aren’t important.
– Rainer Horn, Hapag-Lloyd
Made in China
With the barrier of shipping costs effectively removed, production began to migrate to countries with cheaper production costs.
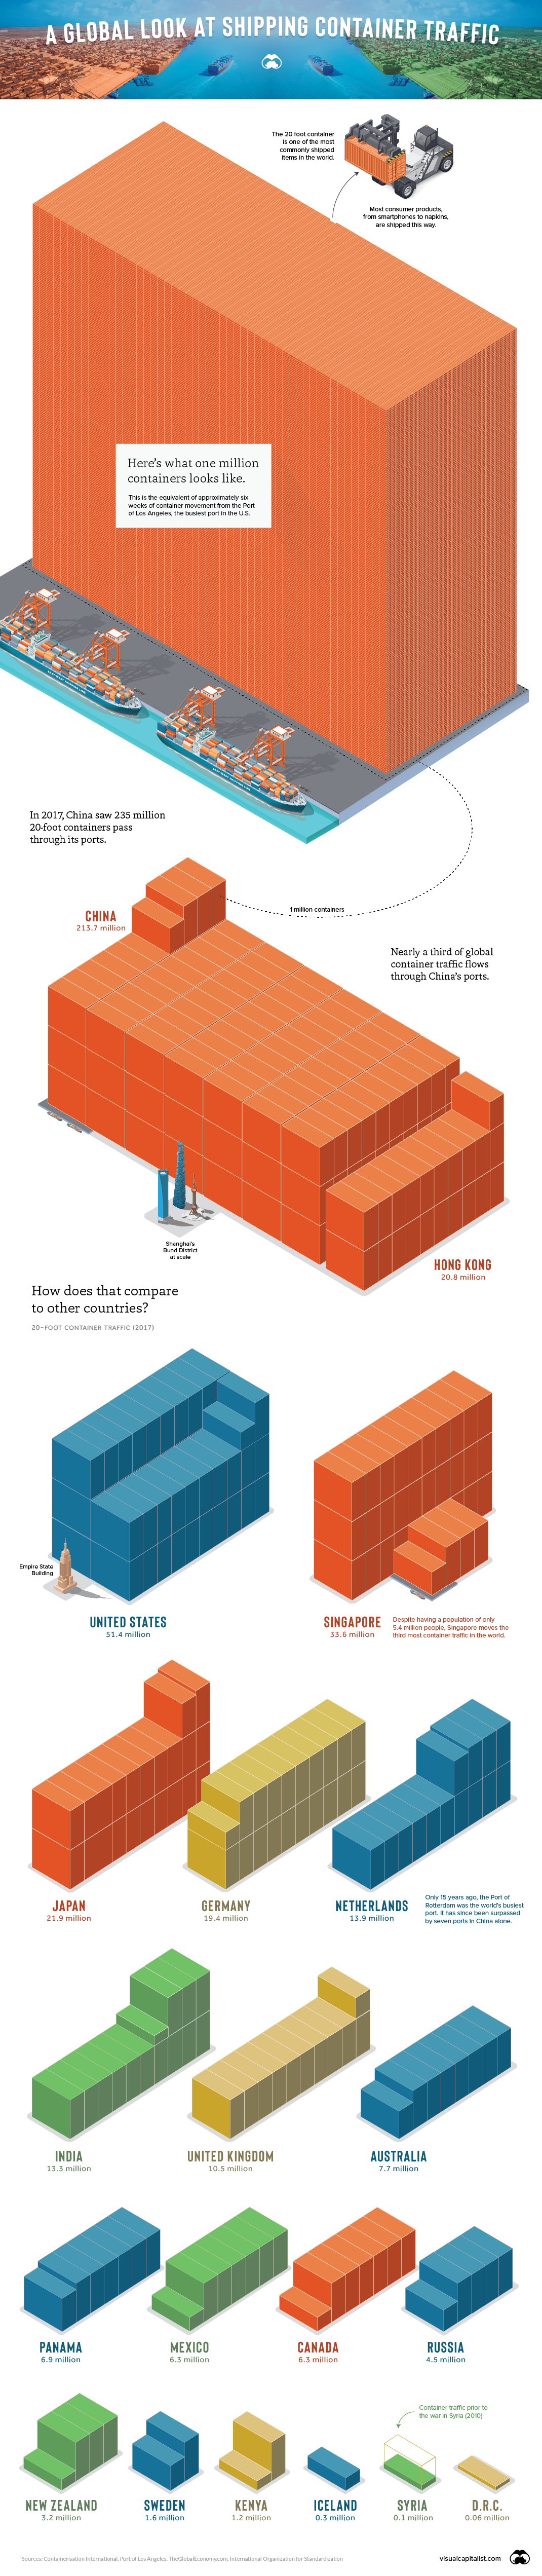
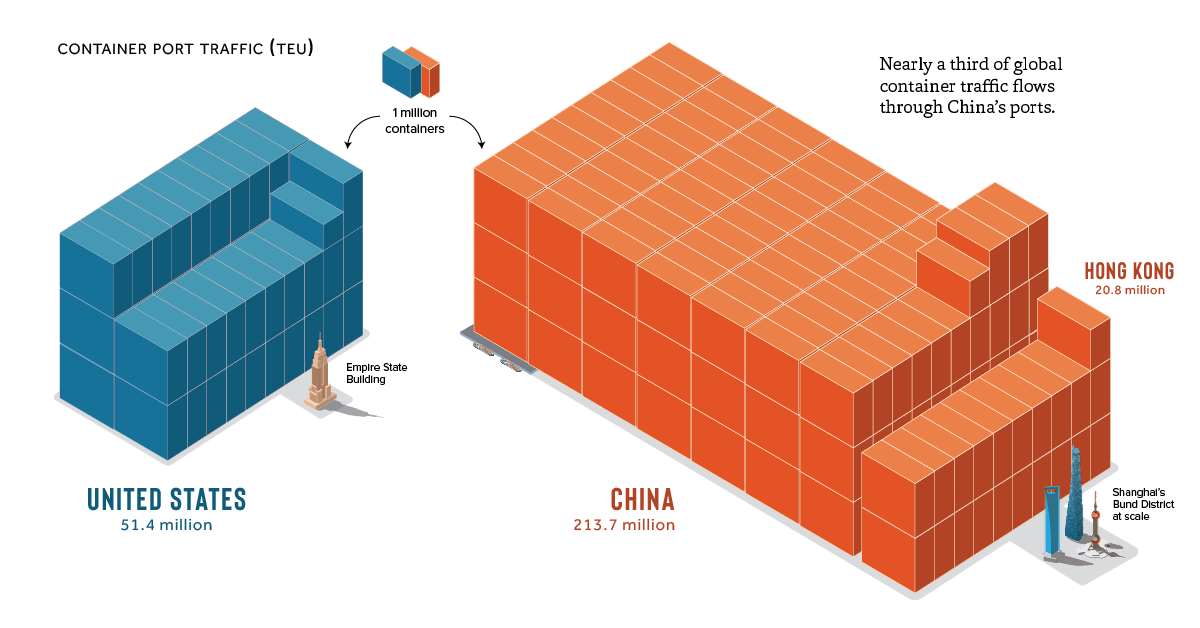
China is at the center of this new paradigm: nearly one-third of all global containers move through Chinese ports, and seven of the top 10 ports in the world are all located in China.
Countries Moving the Most Units
Here are the 50 countries with the most 20-foot containers passing through their ports:
| Rank | Country | 20-Foot Container Count (2017) |
|---|---|---|
| 1 | China (inc. H.K.) | 234,489,920 |
| 2 | United States | 51,425,464 |
| 3 | Singapore | 33,600,000 |
| 4 | South Korea | 27,427,000 |
| 5 | Malaysia | 24,719,000 |
| 6 | Japan | 21,904,444 |
| 7 | U.A.E. | 21,280,900 |
| 8 | Germany | 19,447,600 |
| 9 | Spain | 17,065,000 |
| 10 | Netherlands | 13,951,000 |
| 11 | Indonesia | 13,859,500 |
| 12 | India | 13,259,000 |
| 13 | Vietnam | 12,284,395 |
| 14 | Belgium | 11,857,009 |
| 15 | Thailand | 10,732,000 |
| 16 | Italy | 10,698,030 |
| 17 | United Kingdom | 10,530,328 |
| 18 | Brazil | 10,049,282 |
| 19 | Turkey | 9,927,385 |
| 20 | Saudi Arabia | 8,404,000 |
| 21 | Philippines | 8,196,961 |
| 22 | Australia | 7,693,643 |
| 23 | Egypt | 7,430,000 |
| 24 | Panama | 6,900,000 |
| 25 | France | 6,714,551 |
| 26 | Mexico | 6,305,000 |
| 27 | Canada | 6,298,590 |
| 28 | Sri Lanka | 6,000,000 |
| 29 | Oman | 4,784,712 |
| 30 | South Africa | 4,634,900 |
| 31 | Morocco | 4,570,000 |
| 32 | Russia | 4,515,000 |
| 33 | Greece | 4,461,000 |
| 34 | Chile | 4,189,669 |
| 35 | Colombia | 3,444,503 |
| 36 | New Zealand | 3,227,100 |
| 37 | Portugal | 3,220,100 |
| 38 | Malta | 3,203,000 |
| 39 | Iran | 3,091,000 |
| 40 | Pakistan | 2,985,600 |
| 41 | Israel | 2,865,028 |
| 42 | Bangladesh | 2,587,000 |
| 43 | Poland | 2,459,900 |
| 44 | Peru | 2,368,989 |
| 45 | Ecuador | 1,944,135 |
| 46 | Finland | 1,920,800 |
| 47 | Argentina | 1,750,102 |
| 48 | Jamaica | 1,689,000 |
| 49 | Nigeria | 1,656,000 |
| 50 | Sweden | 1,593,450 |
Asian countries dominate shipping container traffic, taking up four of the top five spots. Singapore, with a population of just 5.4 million, moved nearly 34 million 20-foot containers in 2017. That’s more than Italy, France, Russia, Sweden, and the U.K. combined.
The United States is still the number two country in the world in terms of the number of containers handled. Two massive ports in Los Angeles control over a quarter of the North American market share, and the Port of New York & New Jersey is the largest on the Eastern Seaboard.
The Stack Keeps Growing
Except for a brief slip in 2009, the number of containers moving through ports has increased every year this millennium so far.
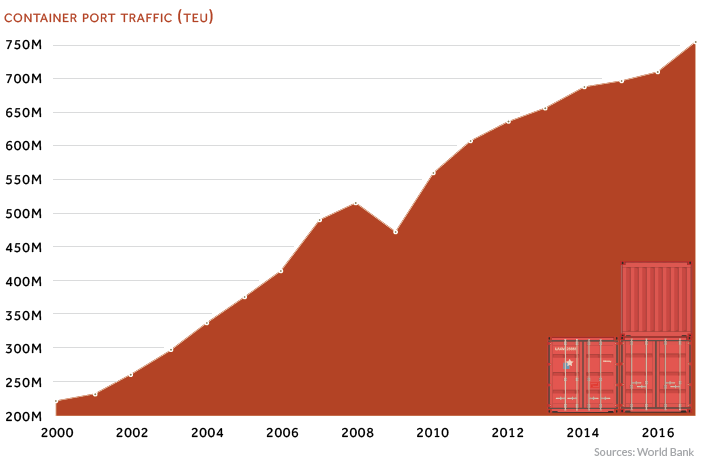
In spite of the recent volley of tariff actions, there appears to be smooth sailing ahead for the growth of containerized shipping.


Markets
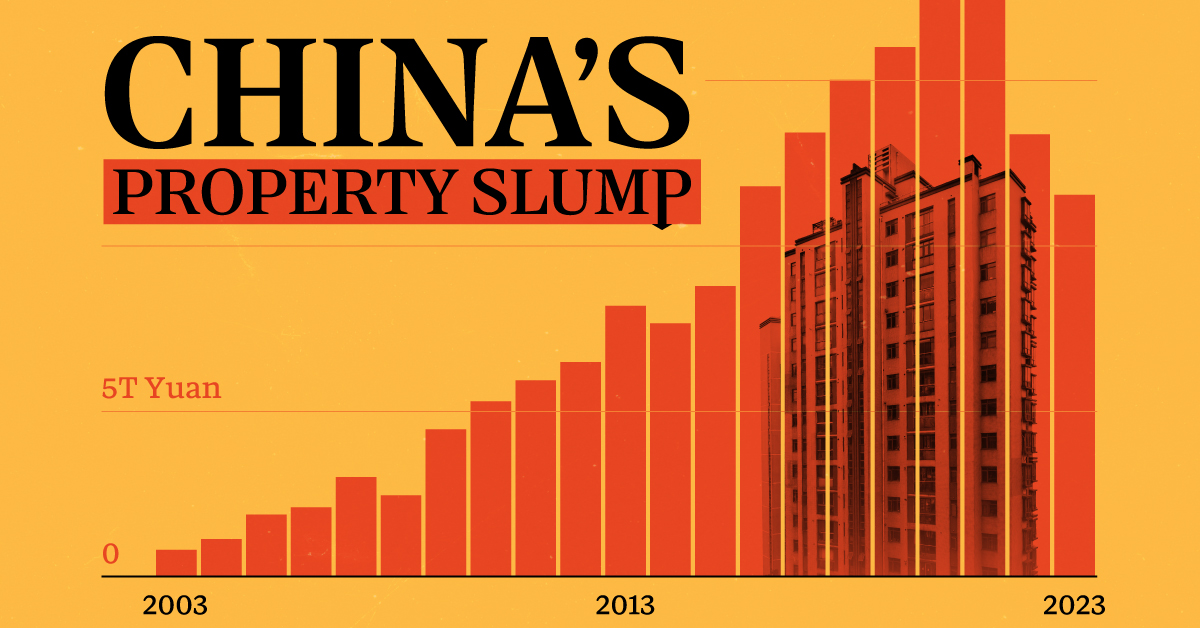
China’s Real Estate Crisis, Shown in Two Charts
These charts show China’s real estate boom in the 21st century and the subsequent slowdown since 2022.
Visualizing China’s Real Estate Boom and Crisis
This was originally posted on our Voronoi app. Download the app for free on iOS or Android and discover incredible data-driven charts from a variety of trusted sources.
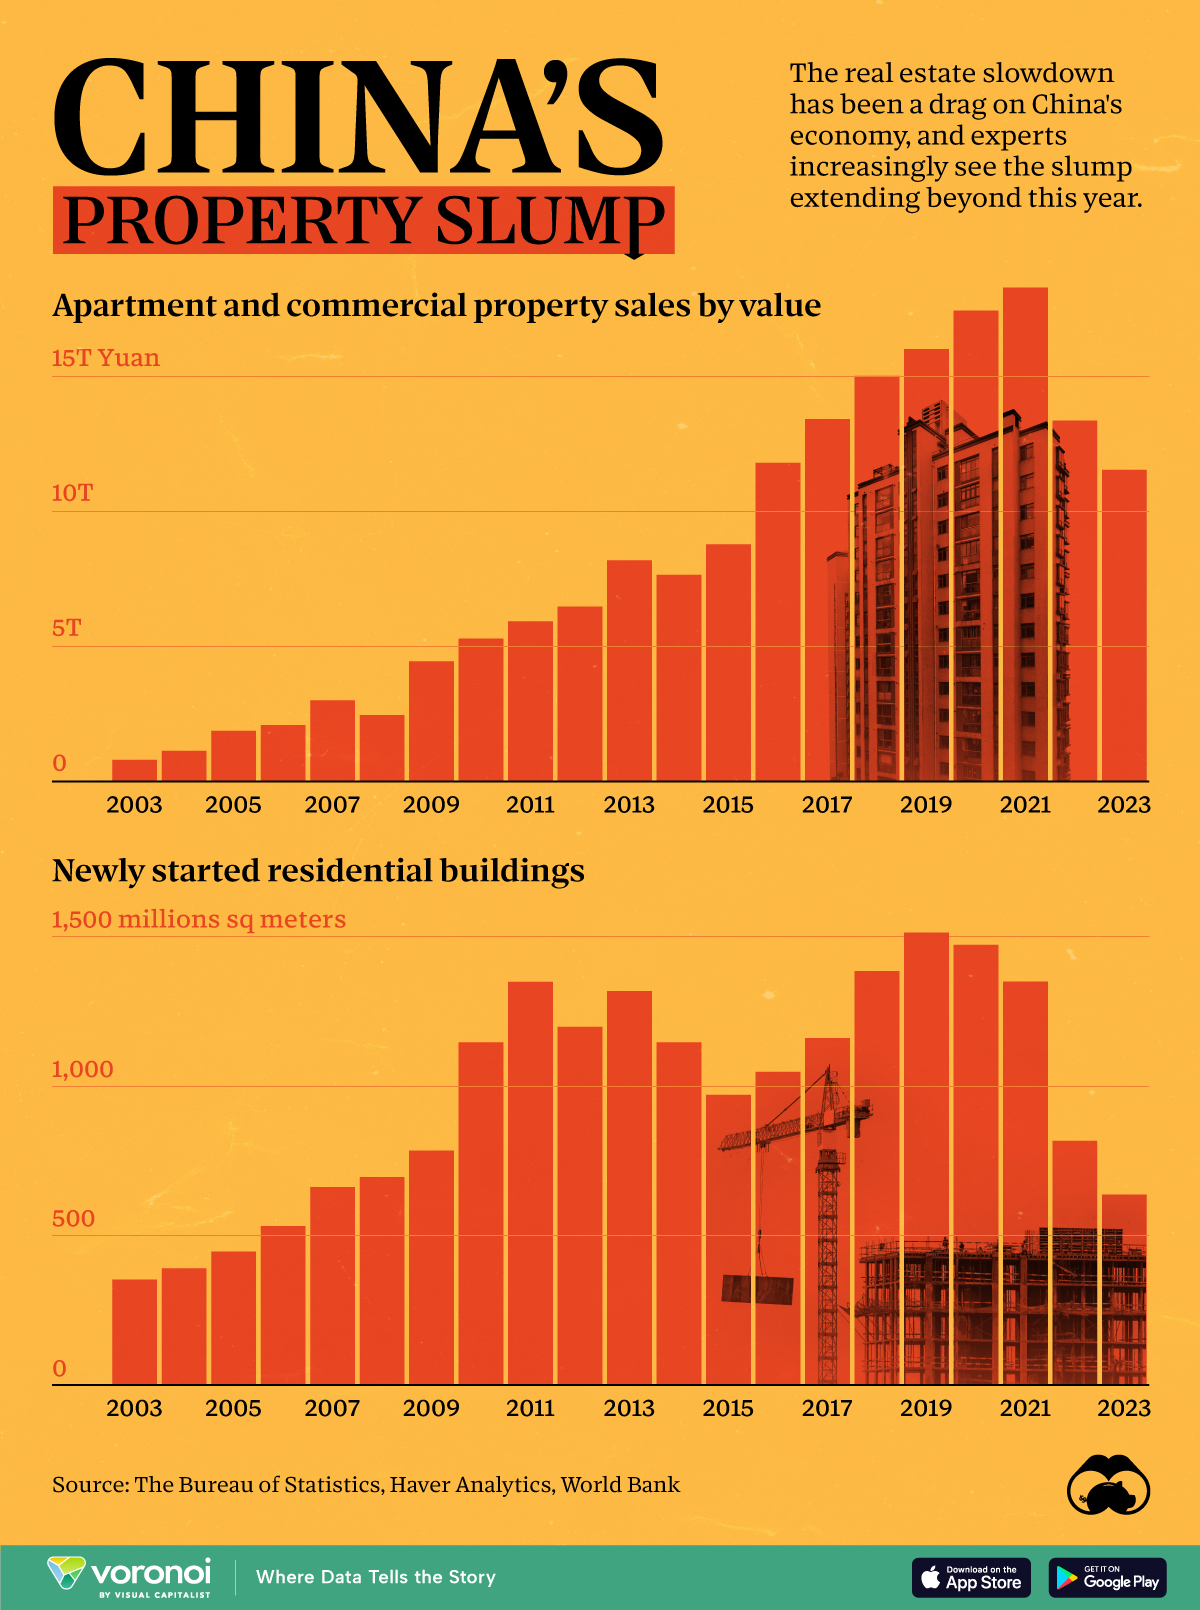
Evergrande—once China’s largest real estate developer—was forced to liquidate on January 28th. It was yet another strike against the country’s now fledgling real estate market, adding to a growing list of China’s economic worries.
In the charts above we show two annual metrics related to China’s real estate crisis from 2003 to 2023. The first looks at apartment and commercial property sales using Burreau of Statistics data from Bloomberg, and the second examines new housing starts using data from the World Bank.
Things to Know About China’s Property Slump
Property sales by value in China climbed pretty steadily from less than ¥1 trillion RMB in 2003 to over ¥15 trillion in 2021, but have since dropped to under ¥12 trillion in 2023.
This was the case across both residential and commercial sales. In China’s residential market specifically, new home sales dropped 6% in 2023, with secondhand home prices declining in major cities.
And on the development side, new residential developments have fallen 58% from 1,515 million m² in 2019 to 637 million m² in 2023.
| Year | New Residential Building Developments (million sq meters) |
|---|---|
| 2023 | 637.4 |
| 2022 | 817.3 |
| 2021 | 1,350.2 |
| 2020 | 1,473.4 |
| 2019 | 1,514.5 |
| 2018 | 1,385.4 |
| 2017 | 1,160.9 |
| 2016 | 1,047.8 |
| 2015 | 970.8 |
| 2014 | 1,146.4 |
| 2013 | 1,318.5 |
| 2012 | 1,199.1 |
| 2011 | 1,349.4 |
| 2010 | 1,147.2 |
| 2009 | 784.9 |
| 2008 | 695.4 |
| 2007 | 662.3 |
| 2006 | 531.8 |
| 2005 | 446.5 |
| 2004 | 390.0 |
| 2003 | 352.4 |
| 2002 | 276.5 |
Here are a few more things to know about the ongoing real estate crisis in China:
- Developer Defaults: Real estate firms faced $125 billion in bond defaults between 2020 and 2023.
- Economic Impact: The property sector’s slump has dragged down China’s economy, leading to layoffs and financial instability.
- Getting Creative: Municipalities, many of which rely on land sales as a key source of income, have been introducing “old-for-new” support measures meant to stimulate new home purchases.
Experts predict a prolonged downturn, with many people souring on Chinese investments, but exactly how things will develop after Evergrande’s collapse is unclear.

-

 Technology7 days ago
All of the Grants Given by the U.S. CHIPS Act
-

 Misc2 weeks ago
How Hard Is It to Get Into an Ivy League School?
-

 Debt2 weeks ago
How Debt-to-GDP Ratios Have Changed Since 2000
-

 Sports2 weeks ago
The Highest Earning Athletes in Seven Professional Sports
-

 Science2 weeks ago
Visualizing the Average Lifespans of Mammals
-

 Brands1 week ago
How Tech Logos Have Evolved Over Time
-

 Energy1 week ago
Ranked: The Top 10 EV Battery Manufacturers in 2023
-

 Demographics1 week ago
Countries With the Largest Happiness Gains Since 2010