Datastream
Electric Vehicles Drive up Metals Demand


The Briefing
- Electric vehicle sales were down 25% at the start of the pandemic but demand is bouncing back
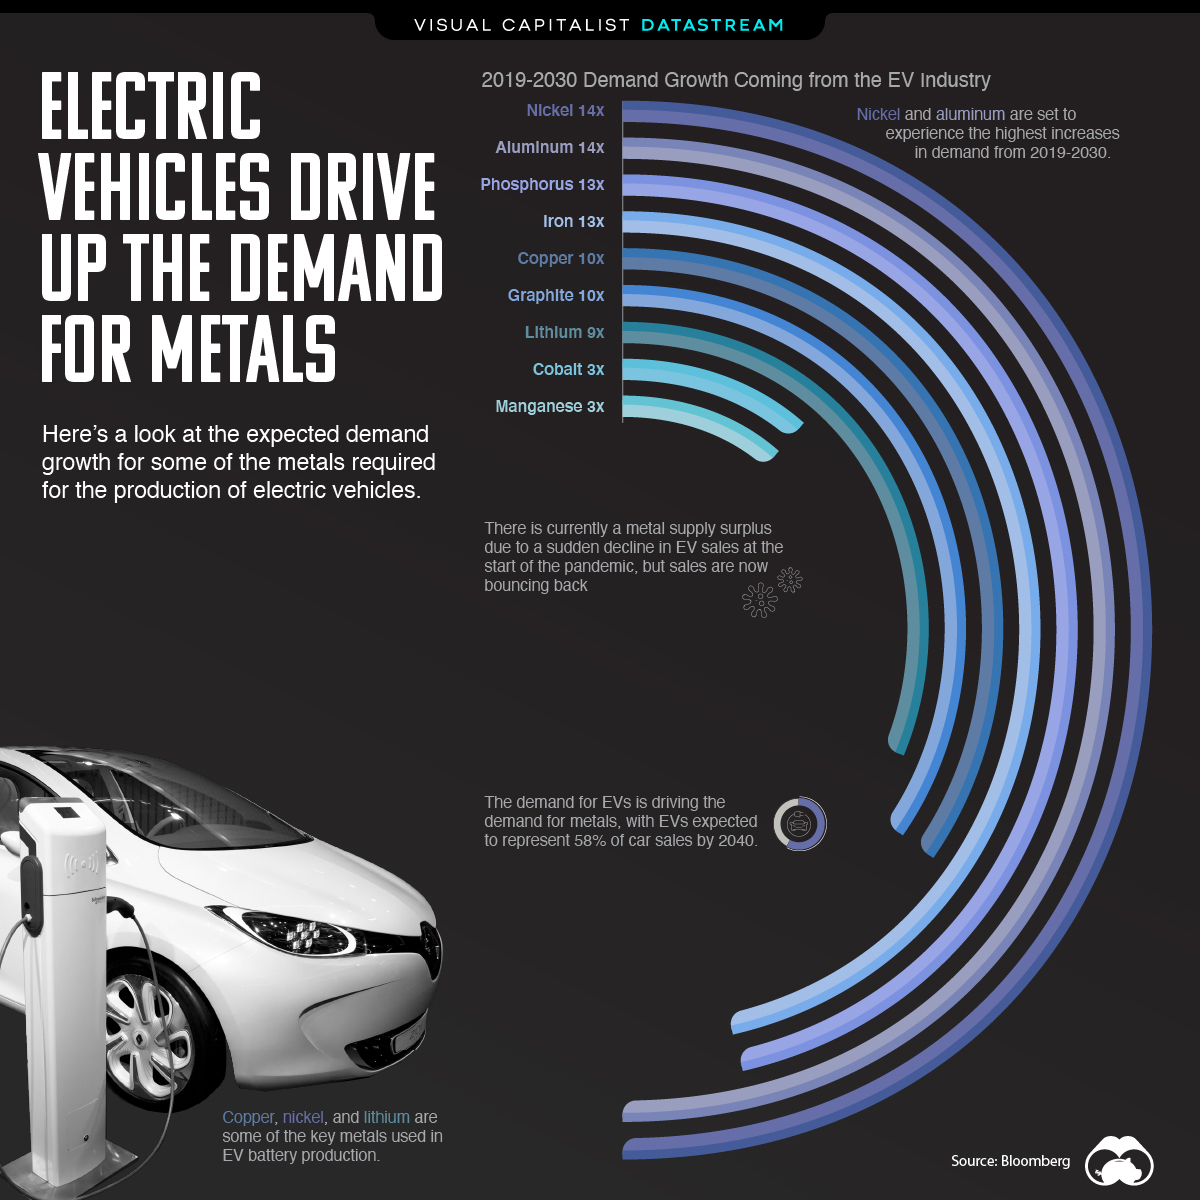
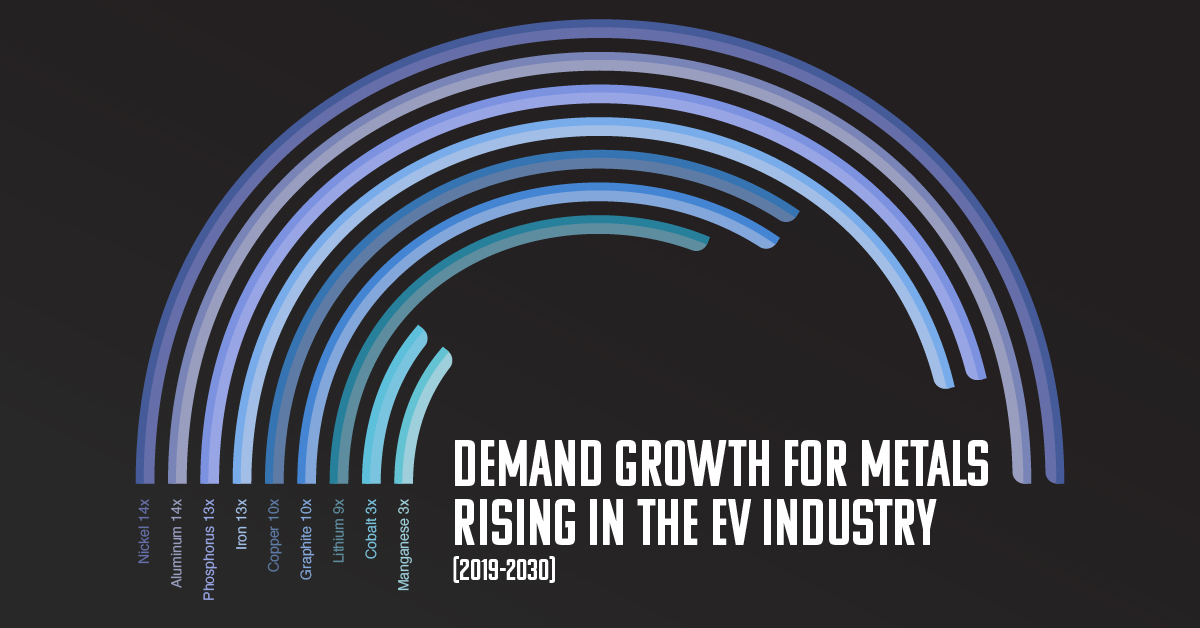
- Demand growth from the EV industry is expected to increase as much as 14x by 2030 for certain key metals used in EV production
Electric Vehicles Drive up Metals Demand
Electric vehicle (EV) sales were abruptly interrupted in 2020 due to COVID-19.
However, the consumer base for these cars isn’t going away any time soon. EVs are becoming increasingly popular thanks to higher environmental awareness, falling costs, and ever-improving infrastructure.
Demand for Metals on the Rise
Demand from the EV industry for key metals is on a swift upward trajectory.
Copper, nickel, and lithium are some of the key metals required for EV battery production. As a result, demand growth for nickel from EVs is expected to increase 14 times between 2019-2030. Lithium and copper are expected to experience a growth in demand of 9-10x.
| Metal | Expected Demand Growth Increase to 2030 in the EV Industry |
|---|---|
| Nickel | 14x |
| Aluminum | 14x |
| Phosphorus | 13x |
| Iron | 13x |
| Copper | 10x |
| Graphite | 10x |
| Lithium | 9x |
| Cobalt | 3x |
| Manganese | 3x |
Many of these raw materials come from low to lower middle-income countries and are essential to their economies. For example, around 50% of the world’s cobalt, another key material for EV manufacturing, is found in the Democratic Republic of the Congo.
Investors and mining companies stand to gain from this increased demand for EVs.
What’s Driving Demand?
As consumer awareness increases around climate change and demand shifts away from the oil and gas industry, the demand for EVs grows immensely. According to some estimates, EVs are expected to make up over half of all passenger vehicle sales by 2040.
Additionally, many governments have committed to the production of EVs in a bid to decrease their dependency on fossil fuels. China, for example, has a goal of having EVs make up 20% of new car sales by 2025.
Tesla is leading the momentum among manufacturers and investors clearly see the opportunity, having driven up Tesla’s shares by over 1,000% since March 2020. But there are other up-and-coming players in the EV market like NIO in China, as well as traditional car makers that are shifting their focus to EVs.
Where does this data come from?
Source: Bloomberg NEF


Datastream
Can You Calculate Your Daily Carbon Footprint?
Discover how the average person’s carbon footprint impacts the environment and learn how carbon credits can offset your carbon footprint.


The Briefing
- A person’s carbon footprint is substantial, with activities such as food consumption creating as much as 4,500 g of CO₂ emissions daily.
- By purchasing carbon credits from Carbon Streaming Corporation, you can offset your own emissions and fund positive climate action.
Your Everyday Carbon Footprint
While many large businesses and countries have committed to net-zero goals, it is essential to acknowledge that your everyday activities also contribute to global emissions.
In this graphic, sponsored by Carbon Streaming Corporation, we will explore how the choices we make and the products we use have a profound impact on our carbon footprint.
Carbon Emissions by Activity
Here are some of the daily activities and products of the average person and their carbon footprint, according to Clever Carbon.
| Household Activities & Products | CO2 Emissions (g) |
|---|---|
| 💡 Standard Light Bulb (100 watts, four hours) | 172 g |
| 📱 Mobile Phone Use (195 minutes per day)* | 189 g |
| 👕 Washing Machine (0.63 kWh) | 275 g |
| 🔥 Electric Oven (1.56 kWh) | 675 g |
| ♨️ Tumble Dryer (2.5 kWh) | 1,000 g |
| 🧻 Toilet Roll (2 ply) | 1,300 g |
| 🚿 Hot Shower (10 mins) | 2,000 g |
| 🚙 Daily Commute (one hour, by car) | 3,360 g |
| 🍽️ Average Daily Food Consumption (three meals of 600 calories) | 4,500 g |
| *Phone use based on yearly use of 69kg per the source, Reboxed | |
Your choice of transportation plays a crucial role in determining your carbon footprint. For instance, a 15 km daily commute to work on public transport generates an average of 1,464 g of CO₂ emissions. Compared to 3,360 g—twice the volume for a journey the same length by car.
By opting for more sustainable modes of transport, such as cycling, walking, or public transportation, you can significantly reduce your carbon footprint.
Addressing Your Carbon Footprint
One way to compensate for your emissions is by purchasing high-quality carbon credits.
Carbon credits are used to help fund projects that avoid, reduce or remove CO₂ emissions. This includes nature-based solutions such as reforestation and improved forest management, or technology-based solutions such as the production of biochar and carbon capture and storage (CCS).
While carbon credits offer a potential solution for individuals to help reduce global emissions, public awareness remains a significant challenge. A BCG-Patch survey revealed that only 34% of U.S. consumers are familiar with carbon credits, and only 3% have purchased them in the past.
About Carbon Streaming
By financing the creation or expansion of carbon projects, Carbon Streaming Corporation secures the rights to future carbon credits generated by these sustainable projects. You can then purchase these carbon credits to help fund climate solutions around the world and compensate for your own emissions.
Ready to get involved?
>> Learn more about purchasing carbon credits at Carbon Streaming

-

 Education1 week ago
How Hard Is It to Get Into an Ivy League School?
-

 Technology2 weeks ago
Ranked: Semiconductor Companies by Industry Revenue Share
-

 Markets2 weeks ago
Ranked: The World’s Top Flight Routes, by Revenue
-

 Demographics2 weeks ago
Population Projections: The World’s 6 Largest Countries in 2075
-

 Markets2 weeks ago
The Top 10 States by Real GDP Growth in 2023
-

 Demographics2 weeks ago
The Smallest Gender Wage Gaps in OECD Countries
-

 Economy2 weeks ago
Where U.S. Inflation Hit the Hardest in March 2024
-

 Green2 weeks ago
Top Countries By Forest Growth Since 2001