Datastream
Ranked: The Countries with the Most Linguistic Diversity
The Briefing
- Papua New Guinea is the most linguistically diverse country in the world, with approximately 840 different languages spoken across the islands
- In second place, Indonesia has around 711 different languages. Only 20% of the population speaks the national language of Bahasa Indonesian at home
Ranked: The Most Diverse Countries By Language
Thousands of languages are spoken worldwide, but only a fraction are used widely. In fact, the speakers of 23 languages account for more than half of the total global population.
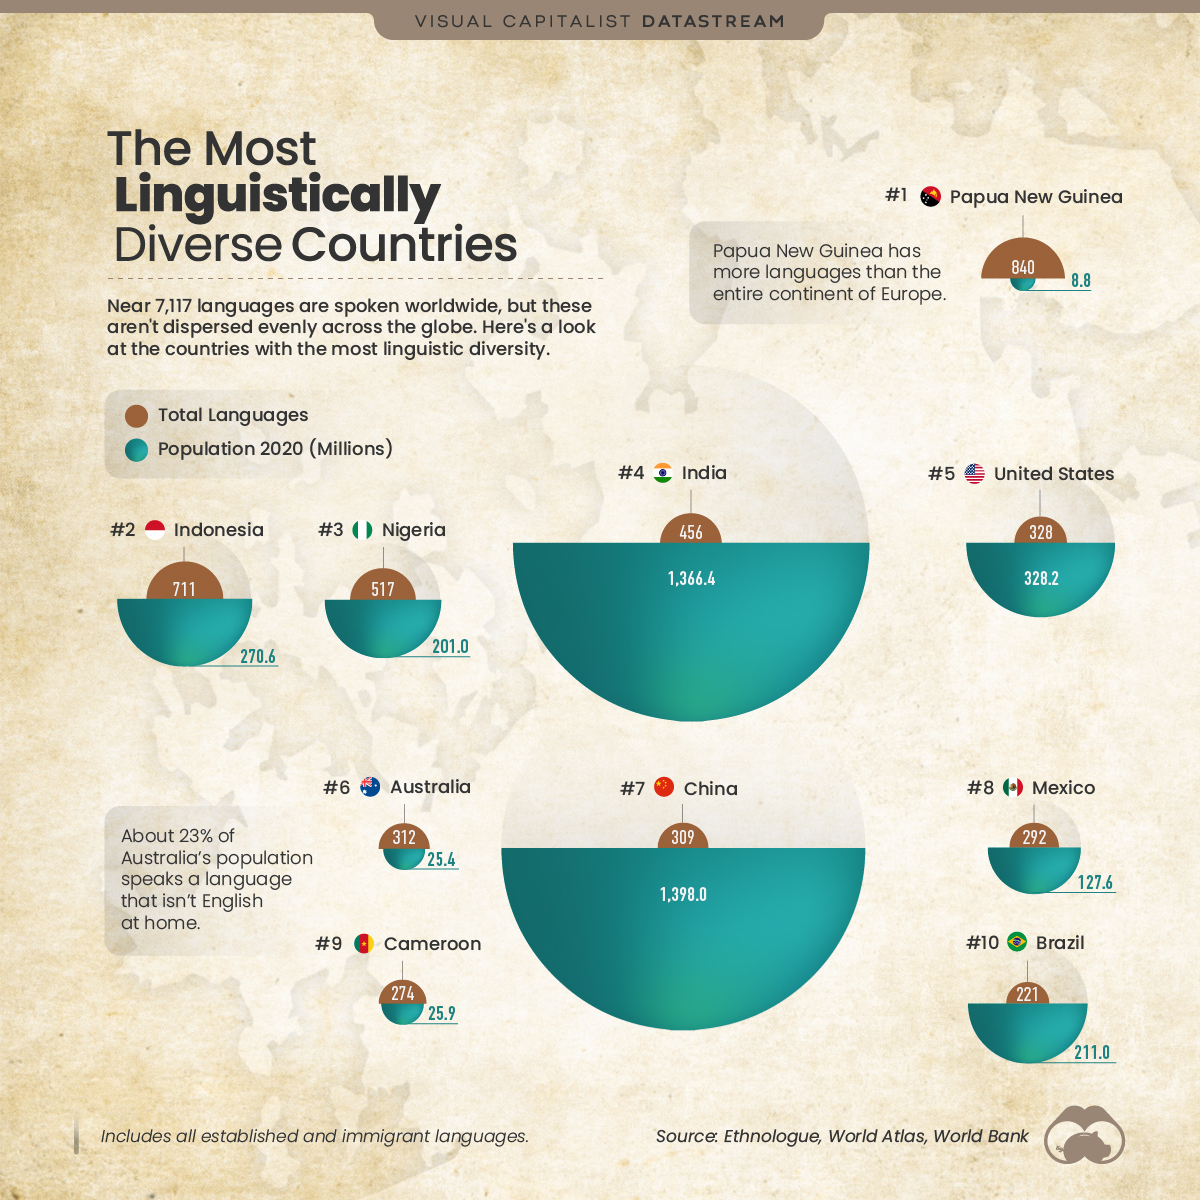
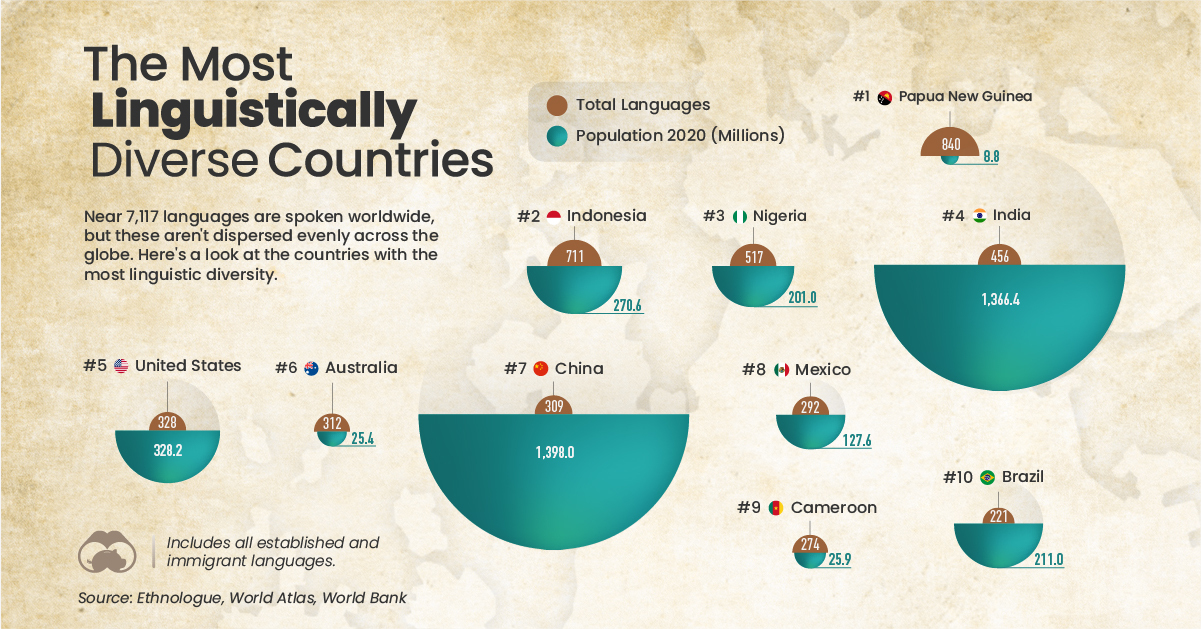
Despite this, there are still pockets around the globe that are rich in linguistic diversity. Here’s a look at the top 10 countries where the most languages are spoken.
These numbers include established and immigrant dialects.
Top 10 Countries with the Most Languages
Despite a population of just 8.8 million, Papua New Guinea comes in first with a total of 840 languages spoken across the country. To put things into perspective, that’s almost 12% of the world’s languages spoken in an area that’s roughly the size of California.
| Rank | Country | Total Languages | Population 2020 (M) |
|---|---|---|---|
| 1 | 🇵🇬 Papua New Guinea | 840 | 8.8 |
| 2 | 🇮🇩 Indonesia | 711 | 270.6 |
| 3 | 🇳🇬 Nigeria | 517 | 201.0 |
| 4 | 🇮🇳 India | 456 | 1,366.0 |
| 5 | 🇺🇸 United States | 328 | 328.2 |
| 6 | 🇦🇺 Australia | 312 | 25.4 |
| 7 | 🇨🇳 China | 309 | 1,398.0 |
| 8 | 🇲🇽 Mexico | 292 | 127.6 |
| 9 | 🇨🇲 Cameroon | 274 | 25.9 |
| 10 | 🇧🇷 Brazil | 221 | 211.0 |
A likely reason for the country’s linguistic diversity is its isolation from modern life. Over 80% of Papua New Guinea’s population lives in rural areas and has minimal contact with external influences or other tribes.
Second on the list is Indonesia, with 711 different languages used throughout the country. Like Papua New Guinea, a major factor that could explain its language diversity is its geography—Indonesia is made up of around 17,500 islands (although more than 7,000 of them are uninhabited).
The Future of Language Diversity
While it’s clear that a multitude of languages still exist, around 40% of the world’s languages are at risk of dying out. Even in parts of the world where immense linguistic diversity remains, languages are disappearing with each subsequent generation.
In efforts to combat this, organizations like the United Nations are actively trying to promote and protect these endangered languages.
>>Like this? Check out our article on the Top 10 Most Spoken Languages
Where does this data come from?
Source: Ethnologue
Notes: This database covers a majority of the world’s population and details approximately 7,111 living languages


Datastream
Can You Calculate Your Daily Carbon Footprint?
Discover how the average person’s carbon footprint impacts the environment and learn how carbon credits can offset your carbon footprint.


The Briefing
- A person’s carbon footprint is substantial, with activities such as food consumption creating as much as 4,500 g of CO₂ emissions daily.
- By purchasing carbon credits from Carbon Streaming Corporation, you can offset your own emissions and fund positive climate action.
Your Everyday Carbon Footprint
While many large businesses and countries have committed to net-zero goals, it is essential to acknowledge that your everyday activities also contribute to global emissions.
In this graphic, sponsored by Carbon Streaming Corporation, we will explore how the choices we make and the products we use have a profound impact on our carbon footprint.
Carbon Emissions by Activity
Here are some of the daily activities and products of the average person and their carbon footprint, according to Clever Carbon.
| Household Activities & Products | CO2 Emissions (g) |
|---|---|
| 💡 Standard Light Bulb (100 watts, four hours) | 172 g |
| 📱 Mobile Phone Use (195 minutes per day)* | 189 g |
| 👕 Washing Machine (0.63 kWh) | 275 g |
| 🔥 Electric Oven (1.56 kWh) | 675 g |
| ♨️ Tumble Dryer (2.5 kWh) | 1,000 g |
| 🧻 Toilet Roll (2 ply) | 1,300 g |
| 🚿 Hot Shower (10 mins) | 2,000 g |
| 🚙 Daily Commute (one hour, by car) | 3,360 g |
| 🍽️ Average Daily Food Consumption (three meals of 600 calories) | 4,500 g |
| *Phone use based on yearly use of 69kg per the source, Reboxed | |
Your choice of transportation plays a crucial role in determining your carbon footprint. For instance, a 15 km daily commute to work on public transport generates an average of 1,464 g of CO₂ emissions. Compared to 3,360 g—twice the volume for a journey the same length by car.
By opting for more sustainable modes of transport, such as cycling, walking, or public transportation, you can significantly reduce your carbon footprint.
Addressing Your Carbon Footprint
One way to compensate for your emissions is by purchasing high-quality carbon credits.
Carbon credits are used to help fund projects that avoid, reduce or remove CO₂ emissions. This includes nature-based solutions such as reforestation and improved forest management, or technology-based solutions such as the production of biochar and carbon capture and storage (CCS).
While carbon credits offer a potential solution for individuals to help reduce global emissions, public awareness remains a significant challenge. A BCG-Patch survey revealed that only 34% of U.S. consumers are familiar with carbon credits, and only 3% have purchased them in the past.
About Carbon Streaming
By financing the creation or expansion of carbon projects, Carbon Streaming Corporation secures the rights to future carbon credits generated by these sustainable projects. You can then purchase these carbon credits to help fund climate solutions around the world and compensate for your own emissions.
Ready to get involved?
>> Learn more about purchasing carbon credits at Carbon Streaming

-

 Technology2 weeks ago
Ranked: The Most Popular Smartphone Brands in the U.S.
-

 Automotive1 week ago
Almost Every EV Stock is Down After Q1 2024
-

 Money1 week ago
Where Does One U.S. Tax Dollar Go?
-

 Green2 weeks ago
Ranked: Top Countries by Total Forest Loss Since 2001
-

 Real Estate2 weeks ago
Visualizing America’s Shortage of Affordable Homes
-

 Maps2 weeks ago
Mapped: Average Wages Across Europe
-

 Mining2 weeks ago
Charted: The Value Gap Between the Gold Price and Gold Miners
-

 Demographics2 weeks ago
Visualizing the Size of the Global Senior Population