Datastream
Which Countries Gained (and Lost) the Most Millionaires in 2020?
 Can I share this graphic?
 When do I need a license?
 Interested in this piece?
The Briefing
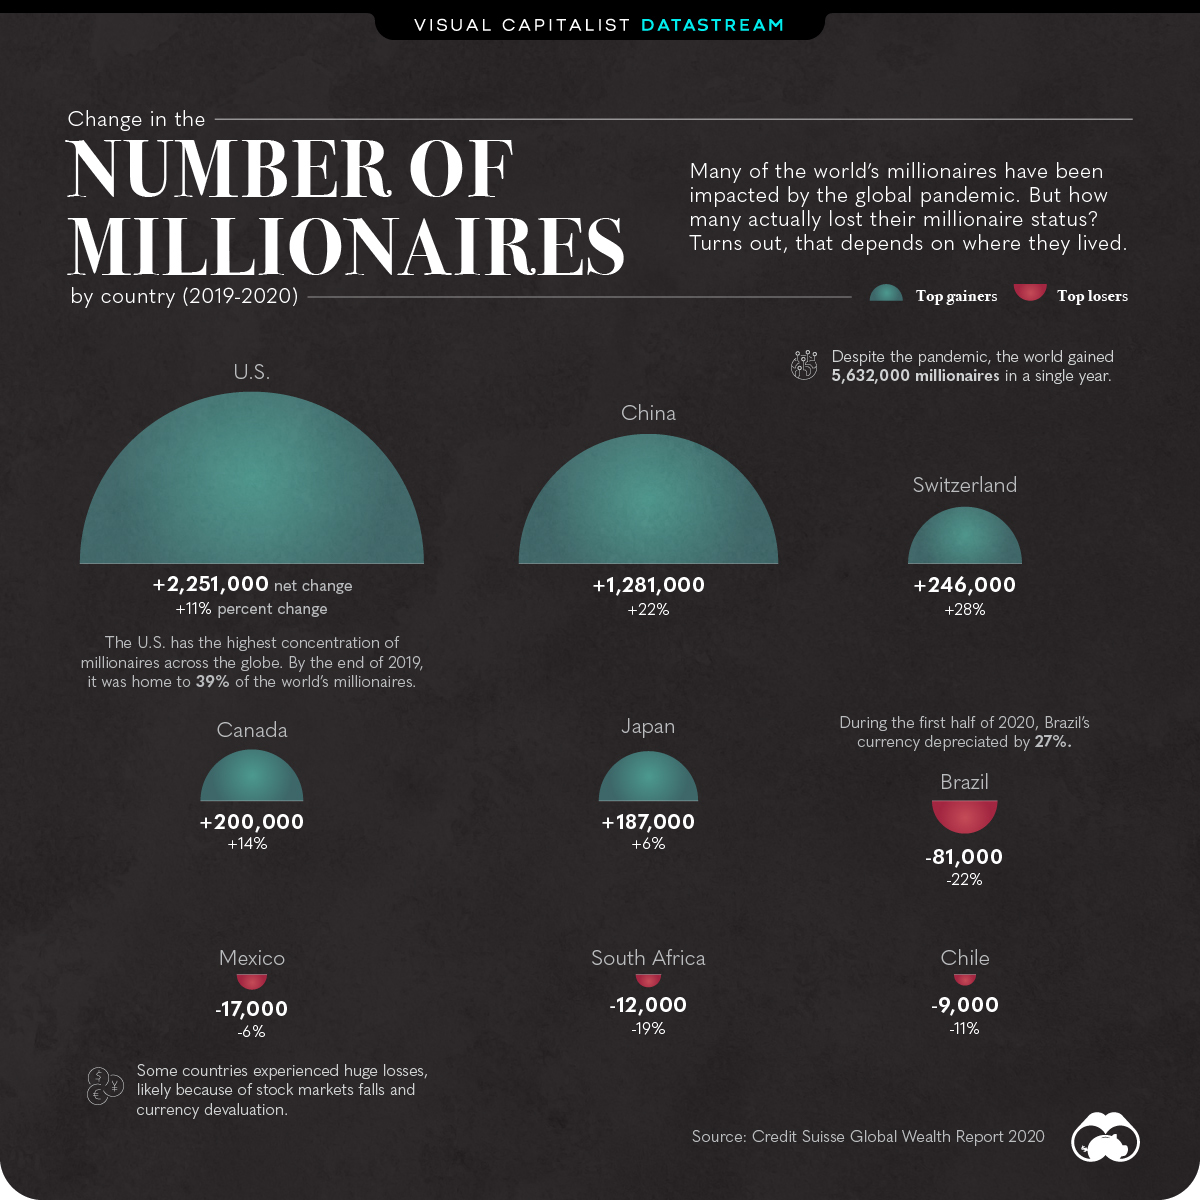
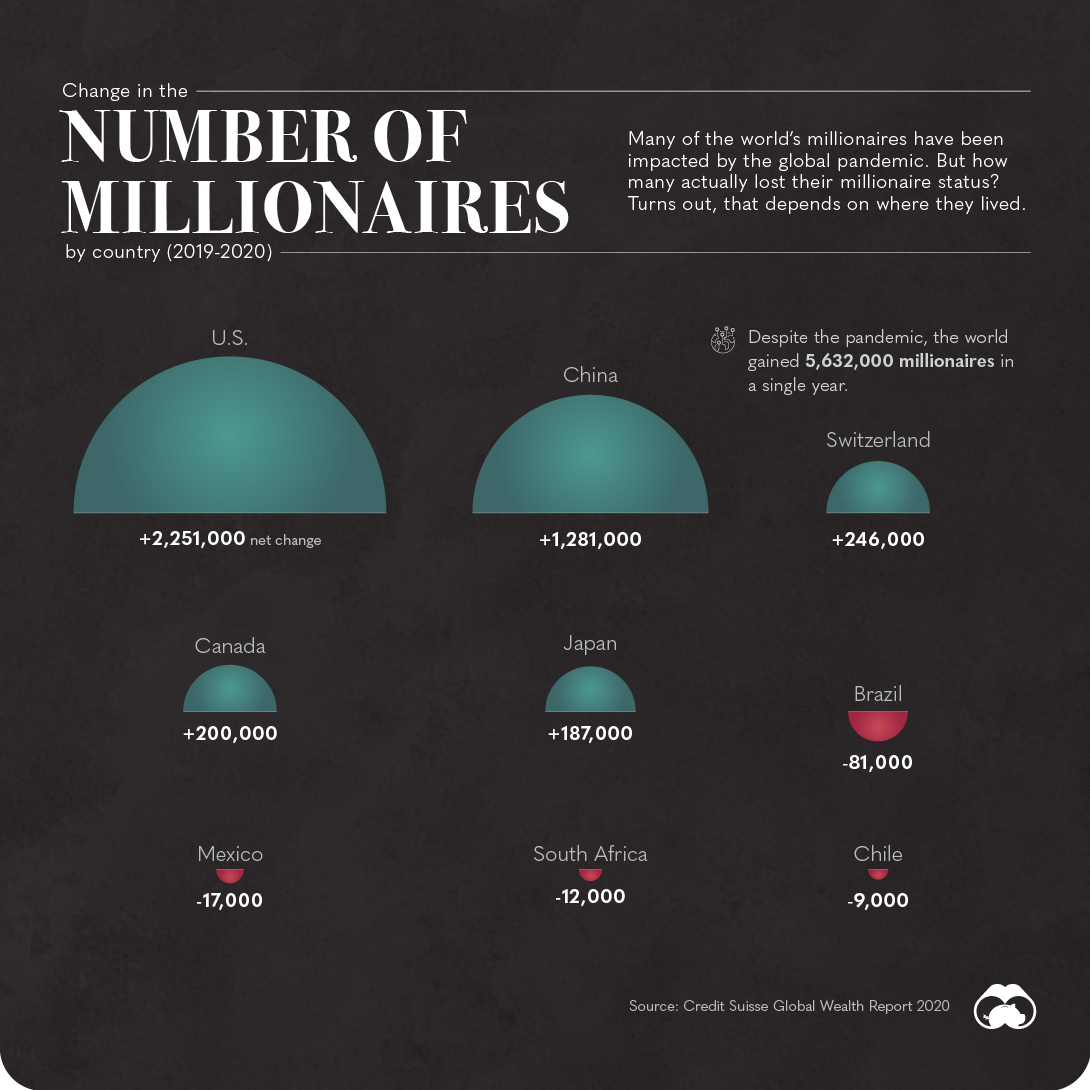
- Despite the pandemic, the world gained 5,632,000 millionaires in a single year
- The U.S. still has the highest concentration of millionaires in the world. From 2019 to 2020, almost 2.3 million Americans achieved millionaire status
- Other countries, such as Brazil and Mexico, lost a significant number of millionaires, likely because of currency devaluation
Which Countries Gained and Lost the Most Millionaires in 2020?
2020 was an unusual year for everyone, and even some of the world’s millionaires had a rough go. But just how much did COVID-19 impact the ultra-wealthy, and how many actually lost their millionaire status in 2020?
The answer to that varies, depending on the region. Here’s a look at which countries gained—and lost—the most millionaires last year.
The World’s Millionaires: Top Gainers and Losers
There was an unusual amount of movement both in and out of the millionaires club in 2020. For instance, the U.S. gained almost 2.3 million new millionaires, while Brazil’s millionaires club lost around 81,000 members compared to its 2019 numbers:
| Country | Net Change, 2019-2020 | % Change, 2019-2020 |
|---|---|---|
| U.S. | +2,251,000 | +11% |
| China | +1,281,000 | +22% |
| Switzerland | +246,000 | +28% |
| Canada | +200,000 | +14% |
| Japan | +187,000 | +6% |
| Chile | -9,000 | -11% |
| South Africa | -12,000 | -19% |
| Mexico | -17,000 | -6% |
| Brazil | -81,000 | -22% |
What are some possible reasons for this discrepancy?
One potential factor is the stock market falls that were triggered by COVID-19. But another likely reason is currency devaluation, which could have happened regardless—during the first half of 2020, Mexico’s currency depreciated by 18%, while Brazil’s dropped by 27%.
Big Loss for Some, Huge Gain for Others
Clearly, the COVID-19 impact has differed greatly across regions.
But geography isn’t the only factor at play—while certain sectors have proven to be pandemic proof, other industries have suffered greatly because of the virus.
For instance, the tech sector thrived last year, and a few key tech billionaires grew their net worth significantly in 2020 as a result. On the flipside, hospitality took a beating, with many restaurants facing permanent closures.
Where does this data come from?
Source: Credit Suisse Global Wealth Report 2020
Details: This annual report is put together by the Credit Suisse Research Institute, and analyzes the household wealth of 5.2 billion people across the globe
Notes: Millionaires are defined as adults with wealth above 1 million USD


Datastream
Can You Calculate Your Daily Carbon Footprint?
Discover how the average person’s carbon footprint impacts the environment and learn how carbon credits can offset your carbon footprint.


The Briefing
- A person’s carbon footprint is substantial, with activities such as food consumption creating as much as 4,500 g of CO₂ emissions daily.
- By purchasing carbon credits from Carbon Streaming Corporation, you can offset your own emissions and fund positive climate action.
Your Everyday Carbon Footprint
While many large businesses and countries have committed to net-zero goals, it is essential to acknowledge that your everyday activities also contribute to global emissions.
In this graphic, sponsored by Carbon Streaming Corporation, we will explore how the choices we make and the products we use have a profound impact on our carbon footprint.
Carbon Emissions by Activity
Here are some of the daily activities and products of the average person and their carbon footprint, according to Clever Carbon.
| Household Activities & Products | CO2 Emissions (g) |
|---|---|
| 💡 Standard Light Bulb (100 watts, four hours) | 172 g |
| 📱 Mobile Phone Use (195 minutes per day)* | 189 g |
| 👕 Washing Machine (0.63 kWh) | 275 g |
| 🔥 Electric Oven (1.56 kWh) | 675 g |
| ♨️ Tumble Dryer (2.5 kWh) | 1,000 g |
| 🧻 Toilet Roll (2 ply) | 1,300 g |
| 🚿 Hot Shower (10 mins) | 2,000 g |
| 🚙 Daily Commute (one hour, by car) | 3,360 g |
| 🍽️ Average Daily Food Consumption (three meals of 600 calories) | 4,500 g |
| *Phone use based on yearly use of 69kg per the source, Reboxed | |
Your choice of transportation plays a crucial role in determining your carbon footprint. For instance, a 15 km daily commute to work on public transport generates an average of 1,464 g of CO₂ emissions. Compared to 3,360 g—twice the volume for a journey the same length by car.
By opting for more sustainable modes of transport, such as cycling, walking, or public transportation, you can significantly reduce your carbon footprint.
Addressing Your Carbon Footprint
One way to compensate for your emissions is by purchasing high-quality carbon credits.
Carbon credits are used to help fund projects that avoid, reduce or remove CO₂ emissions. This includes nature-based solutions such as reforestation and improved forest management, or technology-based solutions such as the production of biochar and carbon capture and storage (CCS).
While carbon credits offer a potential solution for individuals to help reduce global emissions, public awareness remains a significant challenge. A BCG-Patch survey revealed that only 34% of U.S. consumers are familiar with carbon credits, and only 3% have purchased them in the past.
About Carbon Streaming
By financing the creation or expansion of carbon projects, Carbon Streaming Corporation secures the rights to future carbon credits generated by these sustainable projects. You can then purchase these carbon credits to help fund climate solutions around the world and compensate for your own emissions.
Ready to get involved?
>> Learn more about purchasing carbon credits at Carbon Streaming

-

 Markets1 week ago
U.S. Debt Interest Payments Reach $1 Trillion
-

 Markets2 weeks ago
Ranked: The Most Valuable Housing Markets in America
-

 Money2 weeks ago
Which States Have the Highest Minimum Wage in America?
-

 AI2 weeks ago
Ranked: Semiconductor Companies by Industry Revenue Share
-

 Markets2 weeks ago
Ranked: The World’s Top Flight Routes, by Revenue
-

 Countries2 weeks ago
Population Projections: The World’s 6 Largest Countries in 2075
-

 Markets2 weeks ago
The Top 10 States by Real GDP Growth in 2023
-

 Money2 weeks ago
The Smallest Gender Wage Gaps in OECD Countries