Gold
Currency and the Collapse of the Roman Empire

Currency and the Collapse of the Roman Empire
The Money Project is an ongoing collaboration between Visual Capitalist and Texas Precious Metals that seeks to use intuitive visualizations to explore the origins, nature, and use of money.
At its peak, the Roman Empire held up to 130 million people over a span of 1.5 million square miles.
Rome had conquered much of the known world. The Empire built 50,000 miles of roads, as well as many aqueducts, amphitheatres, and other works that are still in use today.
Our alphabet, calendar, languages, literature, and architecture borrow much from the Romans. Even concepts of Roman justice still stand tall, such as being “innocent until proven guilty”.
How could such a powerful empire collapse?
The Roman Economy
Trade was vital to Rome. It was trade that allowed a wide variety of goods to be imported into its borders: beef, grains, glassware, iron, lead, leather, marble, olive oil, perfumes, purple dye, silk, silver, spices, timber, tin and wine.
Trade generated vast wealth for the citizens of Rome. However, the city of Rome itself had only 1 million people, and costs kept rising as the empire became larger.
Administrative, logistical, and military costs kept adding up, and the Empire found creative new ways to pay for things.
Along with other factors, this led to hyperinflation, a fractured economy, localization of trade, heavy taxes, and a financial crisis that crippled Rome.
Roman Debasement
The major silver coin used during the first 220 years of the empire was the denarius.
This coin, between the size of a modern nickel and dime, was worth approximately a day’s wages for a skilled laborer or craftsman. During the first days of the Empire, these coins were of high purity, holding about 4.5 grams of pure silver.
However, with a finite supply of silver and gold entering the empire, Roman spending was limited by the amount of denarii that could be minted.
This made financing the pet-projects of emperors challenging. How was the newest war, thermae, palace, or circus to be paid for?
Roman officials found a way to work around this. By decreasing the purity of their coinage, they were able to make more “silver” coins with the same face value. With more coins in circulation, the government could spend more. And so, the content of silver dropped over the years.
By the time of Marcus Aurelius, the denarius was only about 75% silver. Caracalla tried a different method of debasement. He introduced the “double denarius”, which was worth 2x the denarius in face value. However, it had only the weight of 1.5 denarii. By the time of Gallienus, the coins had barely 5% silver. Each coin was a bronze core with a thin coating of silver. The shine quickly wore off to reveal the poor quality underneath.
The Consequences
The real effects of debasement took time to materialize.
Adding more coins of poorer quality into circulation did not help increase prosperity – it just transferred wealth away from the people, and it meant that more coins were needed to pay for goods and services.
At times, there was runaway inflation in the empire. For example, soldiers demanded far higher wages as the quality of coins diminished.
“Nobody should have any money but I, so that I may bestow it upon the soldiers.” – Caracalla, who raised soldiers pay by 50% near 210 AD.
By 265 AD, when there was only 0.5% silver left in a denarius, prices skyrocketed 1,000% across the Roman Empire.
Only barbarian mercenaries were to be paid in gold.
The Effects
With soaring logistical and admin costs and no precious metals left to plunder from enemies, the Romans levied more and more taxes against the people to sustain the Empire.
Hyperinflation, soaring taxes, and worthless money created a trifecta that dissolved much of Rome’s trade.
The economy was paralyzed.
By the end of the 3rd century, any trade that was left was mostly local, using inefficient barter methods instead of any meaningful medium of exchange.
The Collapse
During the crisis of the 3rd century (235-284 A.D), there may have been more than 50 emperors. Most of these were murdered, assassinated, or killed in battle.
The empire was in a free-for-all, and it split into three separate states.
Constant civil wars meant the Empire’s borders were vulnerable. Trade networks were disintegrated and such activities became too dangerous.
Barbarian invasions came in from every direction. Plague was rampant.
And so the Western Roman Empire would cease to exist by 476 A.D.
About the Money Project
The Money Project aims to use intuitive visualizations to explore ideas around the very concept of money itself. Founded in 2015 by Visual Capitalist and Texas Precious Metals, the Money Project will look at the evolving nature of money, and will try to answer the difficult questions that prevent us from truly understanding the role that money plays in finance, investments, and accumulating wealth.


Mining
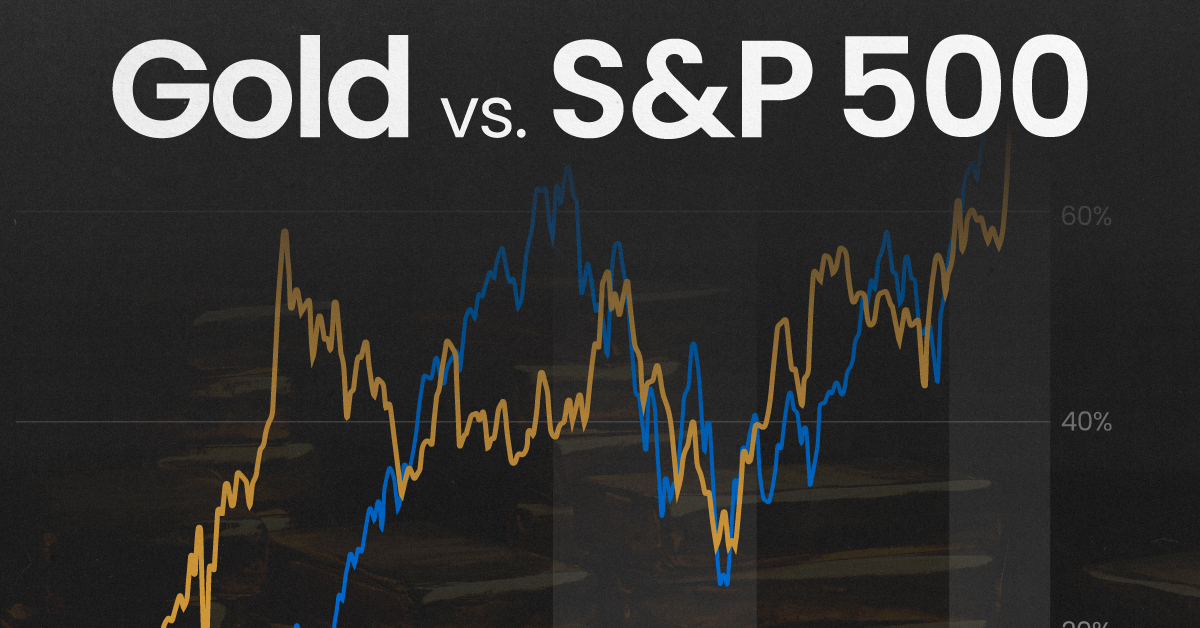
Gold vs. S&P 500: Which Has Grown More Over Five Years?
The price of gold has set record highs in 2024, but how has this precious metal performed relative to the S&P 500?

Gold vs. S&P 500: Which Has Grown More Over Five Years?
This was originally posted on our Voronoi app. Download the app for free on Apple or Android and discover incredible data-driven charts from a variety of trusted sources.
Gold is considered a unique asset due to its enduring value, historical significance, and application in various technologies like computers, spacecraft, and communications equipment.
Commonly regarded as a “safe haven asset”, gold is something investors typically buy to protect themselves during periods of global uncertainty and economic decline.
It is for this reason that gold has performed rather strongly in recent years, and especially in 2024. Persistent inflation combined with multiple wars has driven up demand for gold, helping it set a new all-time high of over $2,400 per ounce.
To put this into perspective, we visualized the performance of gold alongside the S&P 500. See the table below for performance figures as of April 12, 2024.
| Asset/Index | 1 Yr (%) | 5 Yr (%) |
|---|---|---|
| 🏆 Gold | +16.35 | +81.65 |
| 💼 S&P 500 | +25.21 | +76.22 |
Over the five-year period, gold has climbed an impressive 81.65%, outpacing even the S&P 500.
Get Your Gold at Costco
Perhaps a sign of how high the demand for gold is becoming, wholesale giant Costco is reportedly selling up to $200 million worth of gold bars every month in the United States. The year prior, sales only amounted to $100 million per quarter.
Consumers aren’t the only ones buying gold, either. Central banks around the world have been accumulating gold in very large quantities, likely as a hedge against inflation.
According to the World Gold Council, these institutions bought 1,136 metric tons in 2022, marking the highest level since 1950. Figures for 2023 came in at 1,037 metric tons.
See More Graphics on Gold
If you’re fascinated by gold, be sure to check out more Visual Capitalist content including 200 Years of Global Gold Production, by Country or Ranked: The Largest Gold Reserves by Country.

-

 Mining1 week ago
Gold vs. S&P 500: Which Has Grown More Over Five Years?
-

 Markets2 weeks ago
Ranked: The Most Valuable Housing Markets in America
-

 Money2 weeks ago
Which States Have the Highest Minimum Wage in America?
-

 AI2 weeks ago
Ranked: Semiconductor Companies by Industry Revenue Share
-

 Markets2 weeks ago
Ranked: The World’s Top Flight Routes, by Revenue
-

 Countries2 weeks ago
Population Projections: The World’s 6 Largest Countries in 2075
-

 Markets2 weeks ago
The Top 10 States by Real GDP Growth in 2023
-

 Demographics2 weeks ago
The Smallest Gender Wage Gaps in OECD Countries