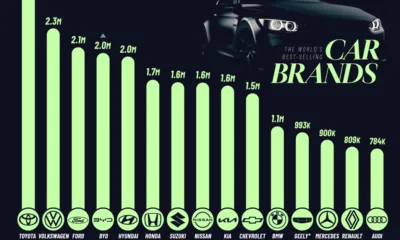
A notable trend is the rise of Chinese manufacturers, especially BYD and Geely.


click for more →
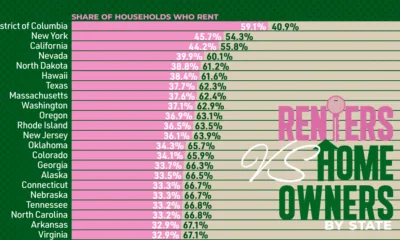

Amid an ongoing affordability crisis, we show the share of households that are renting vs owning—highlighting a wide spectrum across states.
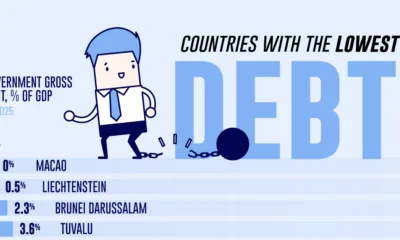

We show the top 20 countries with the lowest debt, highlighting the strong concentration of nations and territories in Asia.
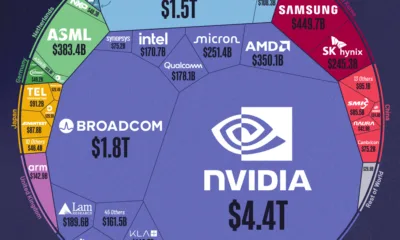

Explore the world's semiconductor industry by market cap, highlighting Nvidia’s massive 37% share of the global total.


As America grapples with a growing affordability crisis, we map the homeownership rate across states in 2024.
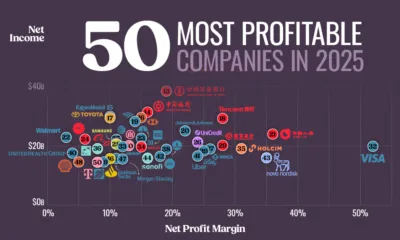

Alphabet, Apple, and Microsoft lead global profitability.


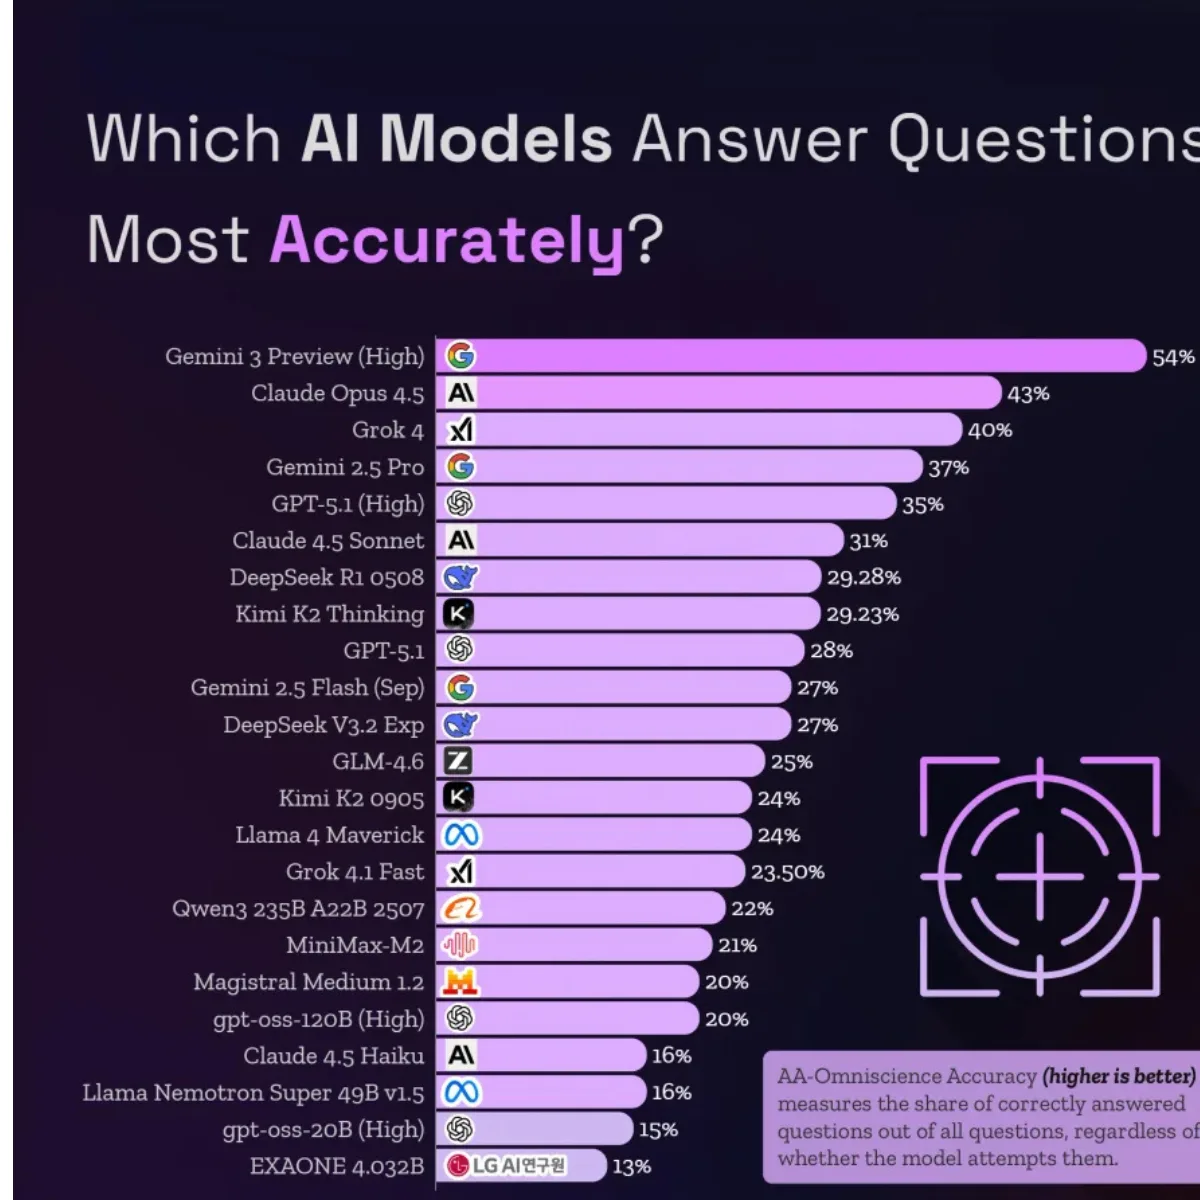
Want AI your team will trust? Pull back the curtain on the top factors that make people believe in artificial intelligence.


The top 1% earn 19.5% of U.S. income but pay 37% of total income taxes.


While income inequality in Texas and Florida mirror the national average, Washington D.C. faces more pronounced wage gaps.
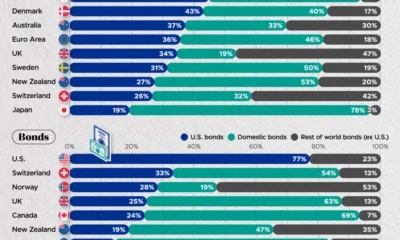

We show how U.S. assets make up a significant share of investment allocation across many countries around the world.
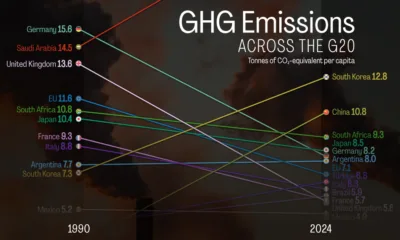

Saudi Arabia emits several times more per person than major European economies.


click for more →