Green
Visualizing the Impact of Rising Sea Levels, by Country
Article/Editing:
Climate change is already causing sea levels to rise across the globe. In the 20th century alone, it’s estimated that the mean global sea level rose by 11-16 cm.
How much will sea levels change in the coming years, and how will it affect our population?
In the below series of visualizations by Florent Lavergne, we can see how rising sea levels could impact countries in terms of flood risk by the year 2100.
These graphics use data from a 2019 study by Scott Kulp and Benjamin Strauss. Their study used CoastalDEM—a 3D graphics tool used to measure a population’s potential exposure to extreme coastal water levels—and examined rising sea levels under different levels of greenhouse gas (GHG) emissions.
Flood Risk By Region
Which countries will be most severely affected by rising sea levels?
If things continue as they are, roughly 360 million people around the world could be at risk of annual flood events by 2100. Here’s what those figures look like across each region:
Africa

On the continent of Africa, one of the countries with the highest number of people at risk of coastal flooding is Egypt.
Over 95% of Egypt’s population lives along the Nile river, with some areas situated at extremely low elevations. The country’s lowest point is 133 m below sea level.
Asia

Asia’s population will be more heavily impacted by flooding than any other region included in the dataset.
According to the projections, 70% of the people that will be affected by rising sea levels are located in just eight Asian countries: China, Bangladesh, India, Vietnam, Indonesia, Thailand, the Philippines, and Japan.
Europe

One of the most high-risk populations in Europe is the Netherlands. The country has a population of about 17 million, and as of 2019, about half of its population lives in areas below sea level.
The country’s lowest point, the town Nieuwekerk aan den Ijssel, is 6.8 m below sea level.
North America

In North America, the U.S., Canada, and Mexico are expected to see the highest numbers of impacted people, due to the size of their populations.
But as a percentage of population, other countries in Central America and the Caribbean are more greatly at risk, especially in high emission scenarios. One country worth highlighting is the Bahamas. Even based on moderate emission levels, the country is expected to see a significant surge in the number of people at risk of flood.
According to the World Bank, this is because land in the Bahamas is relatively flat, making the island especially vulnerable to sea level rises and flooding.
South America

As South America’s largest country by population and with large coastal cities, Brazil‘s population is the most at risk for flood caused by rising sea levels.
Notably, thanks to a lot of mountainous terrain and municipalities situated on high elevation, no country in South America faces a flood risk impacting more than 1 million people.
Oceania
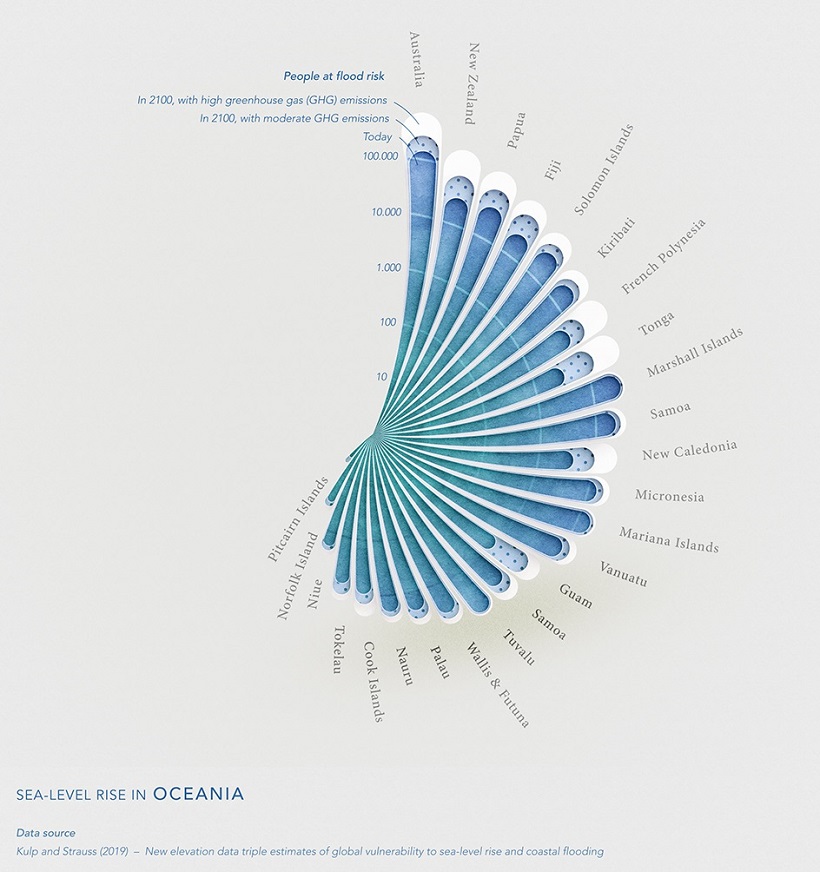
By 2100, Polynesian countries like Tonga are projected to see massive increases in the number of people at risk of flooding, even at moderate GHG emissions.
According to Reuters, sea levels in Tonga have been rising by 6 mm each year, which is nearly double the average global rate. The reason for this is because the islands sit in warmer waters, where sea level changes are more noticeable than at the poles.
What’s Causing Sea Levels to Rise?
Since 1975, average temperatures around the world have risen 0.15 to 0.20°C each decade, according to research by NASA.
This global heating has caused polar ice caps to begin melting—in just over two decades, we’ve lost roughly 28 trillion tonnes of our world’s ice. Over that same timeframe, global sea levels have risen by an average of 36 mm. These rising sea levels pose a number of risks, including soil contamination, loss of habitat, and flooding.
As countries are affected by climate change in different ways, and at different levels, the question becomes how they will respond in turn.


This article was published as a part of Visual Capitalist's Creator Program, which features data-driven visuals from some of our favorite Creators around the world.


Green
The Carbon Footprint of Major Travel Methods
Going on a cruise ship and flying domestically are the most carbon-intensive travel methods.


The Carbon Footprint of Major Travel Methods
This was originally posted on our Voronoi app. Download the app for free on iOS or Android and discover incredible data-driven charts from a variety of trusted sources.
Did you know that transport accounts for nearly one-quarter of global energy-related carbon dioxide (CO₂) emissions?
This graphic illustrates the carbon footprints of major travel methods measured in grams of carbon dioxide equivalent (CO₂e) emitted per person to travel one kilometer. This includes both CO₂ and other greenhouse gases.
Data is sourced from Our World in Data, the UK Government’s Department for Energy Security and Net Zero, and The International Council on Clean Transportation, as of December 2022.
These figures should be interpreted as approximations, rather than exact numbers. There are many variables at play that determine the actual carbon footprint in any individual case, including vehicle type or model, occupancy, energy mix, and even weather.
Cruise Ships are the Most Carbon-Intensive Travel Method
According to these estimates, taking a cruise ship, flying domestically, and driving alone are some of the most carbon-intensive travel methods.
Cruise ships typically use heavy fuel oil, which is high in carbon content. The average cruise ship weighs between 70,000 to 180,000 metric tons, meaning they require large engines to get moving.
These massive vessels must also generate power for onboard amenities such as lighting, air conditioning, and entertainment systems.
Short-haul flights are also considered carbon-intensive due to the significant amount of fuel consumed during initial takeoff and climbing altitude, relative to a lower amount of cruising.
| Transportation method | CO₂ equivalent emissions per passenger km |
|---|---|
| Cruise Ship | 250 |
| Short-haul flight (i.e. within a U.S. state or European country) | 246 |
| Diesel car | 171 |
| Gas car | 170 |
| Medium-haul flight (i.e. international travel within Europe, or between U.S. states) | 151 |
| Long-haul flight (over 3,700 km, about the distance from LA to NY) | 147 |
| Motorbike | 113 |
| Bus (average) | 96 |
| Plug-in hybrid | 68 |
| Electric car | 47 |
| National rail | 35 |
| Tram | 28 |
| London Underground | 27 |
| Ferry (foot passenger) | 19 |
| Eurostar (International rail) | 4.5 |
Are EVs Greener?
Many experts agree that EVs produce a lower carbon footprint over time versus traditional internal combustion engine (ICE) vehicles.
However, the batteries in electric vehicles charge on the power that comes straight off the electrical grid—which in many places may be powered by fossil fuels. For that reason, the carbon footprint of an EV will depend largely on the blend of electricity sources used for charging.
There are also questions about how energy-intensive it is to build EVs compared to a comparable ICE vehicle.

-

 Education1 week ago
How Hard Is It to Get Into an Ivy League School?
-

 Technology2 weeks ago
Ranked: Semiconductor Companies by Industry Revenue Share
-

 Markets2 weeks ago
Ranked: The World’s Top Flight Routes, by Revenue
-

 Demographics2 weeks ago
Population Projections: The World’s 6 Largest Countries in 2075
-

 Markets2 weeks ago
The Top 10 States by Real GDP Growth in 2023
-

 Demographics2 weeks ago
The Smallest Gender Wage Gaps in OECD Countries
-

 Economy2 weeks ago
Where U.S. Inflation Hit the Hardest in March 2024
-

 Green2 weeks ago
Top Countries By Forest Growth Since 2001