United States
Ranked: The 20 Most Popular Neighborhoods for Potential U.S. Homebuyers
Article/Editing:
Most Popular Neighborhoods for Potential U.S. Homebuyers
Location, location, location. This phrase has been a real estate mantra since time immemorial, and rightly so. Finding the right home is impossible without finding the right neighborhood.
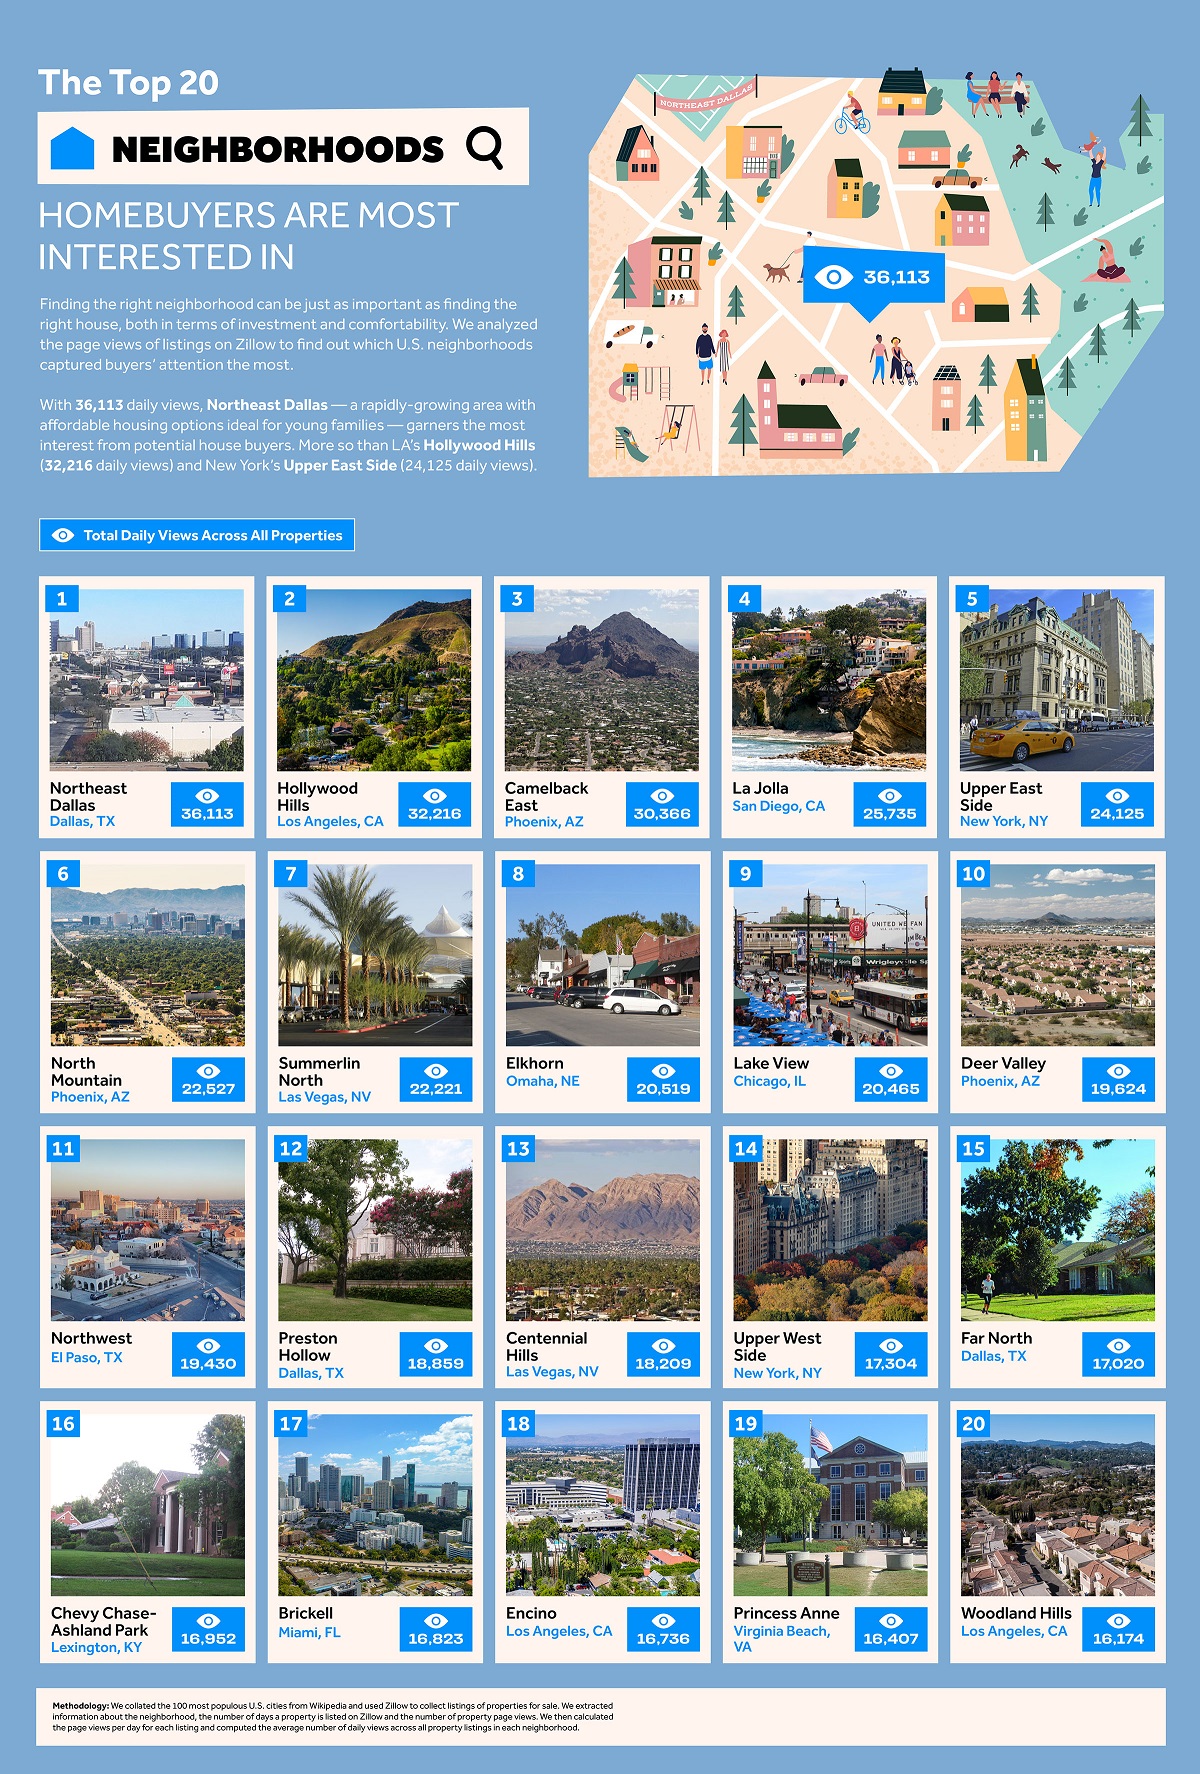
Thousands of U.S. homebuyers scout online real estate marketplaces daily, searching for the right home. But these sites also attract window shoppers curious about the country’s nicest neighborhoods and luxurious homes.
HouseFresh has compiled the top 20 most popular neighborhoods by online interest, based on the search history of Zillow users.
Methodology
This study assessed sales listings from the 100 most populous cities in the U.S.
It noted the neighborhood and page views for every house, townhome, apartment, and condo, and the number of days it had been listed on the website to calculate the average page views per day.
Average daily views across each neighborhood were then combined and ranked to reveal the top 20 neighborhoods. Neighborhoods with fewer than 10 listings were excluded from the rankings.
America’s Most Popular Neighborhoods by Search Interest
In the post-pandemic world, surging housing prices have been a critical concern for American homebuyers.
That’s likely why the most popular neighborhood—Northeast Dallas, which is highly sought-after for being in a strong market with lots of options in both size and affordability—can outperform more famous neighborhoods in viewing interest.
Here are how different neighborhoods in the U.S. stacked up:
Other strong cities for both first-time and second-time home buyers performed well. With affordable house values, sunny skies, large recreation spaces, and a dry climate, Phoenix had the strongest interest for a single city with three neighborhoods in the top 10: Camelback East, North Mountain, and Deer Valley.
On the other end of the spectrum were some of the nation’s most valuable real estate markets. Los Angeles’ celebrity hub of Hollywood Hills had the highest average price per listing at $2.3 million, and was the second-most popular neighborhood in average daily views. Listings in New York’s affluent Upper East Side also drew in crowds and was the 5th most viewed neighborhood.
The Zillow data has revealed that a neighborhood’s popularity varies depending on the viewer. While some look for affordable neighborhoods with big houses and parks, others have their eyes on the glamor of a vibrant city, irrespective of the cost.

This article was published as a part of Visual Capitalist's Creator Program, which features data-driven visuals from some of our favorite Creators around the world.


Misc
Visualizing the Most Common Pets in the U.S.
Lions, tigers, and bears, oh my!—these animals do not feature on this list of popular American household pets.


Visualizing The Most Common Pets in the U.S.
This was originally posted on our Voronoi app. Download the app for free on iOS or Android and discover incredible data-driven charts from a variety of trusted sources.
In this graphic, we visualized the most common American household pets, based on 2023-2024 data from the American Pet Products Association (accessed via Forbes Advisor).
Figures represent the number of households that own each pet type, rather than the actual number of each animal. The “small animal” category includes hamsters, gerbils, rabbits, guinea pigs, chinchillas, mice, rats, and ferrets.
What is the Most Popular American Household Pet?
Based on this data, dogs—one of the first domesticated animals—are the most common pets in the United States. In fact, around 65 million households own a dog, and spend an average of $900 a year on their care.
| Rank | Species | Households |
|---|---|---|
| 1 | 🐶 Dog | 65M |
| 2 | 🐱 Cat | 47M |
| 3 | 🐟 Freshwater Fish | 11M |
| 4 | 🐰 Small Animals | 7M |
| 5 | 🐦 Bird | 6M |
| 6 | 🦎 Reptile | 6M |
| 7 | 🐴 Horse | 2M |
| 8 | 🐠 Saltwater Fish | 2M |
Note: Households can own multiple pets, and are counted for all relevant categories.
Cats rank second, at 47 million households, and these smaller felines are a little less expensive to own at $700/year according to Forbes estimates.
But aside from these two juggernauts, there are plenty of other common pet types found in households across the country.
Freshwater fish can be found in 11 million households, along with small animals—rabbits, hamsters, guinea pigs—in 7 million. Meanwhile, nearly 6 million homes have birds or reptiles.
Pet Ownership is on the Rise in America
Forbes found that 66% of all American households (numbering 87 million) own at least one pet, up from 56% in 1988. One third of these (29 million) own multiple pets.
A combination of factors is driving this increase: rising incomes, delayed childbirth, and of course the impact of the pandemic which nearly cleared out animal shelters across the globe.
America’s loneliness epidemic may also be a factor. Fledgling research has shown that single-individual households with pets recorded lower rates of loneliness during the pandemic than those without a pet.

-

 Demographics7 days ago
The Countries That Have Become Sadder Since 2010
-

 Green2 weeks ago
Ranked: The Countries With the Most Air Pollution in 2023
-

 Green2 weeks ago
Ranking the Top 15 Countries by Carbon Tax Revenue
-

 Markets2 weeks ago
U.S. Debt Interest Payments Reach $1 Trillion
-

 Mining2 weeks ago
Gold vs. S&P 500: Which Has Grown More Over Five Years?
-

 Energy2 weeks ago
The World’s Biggest Nuclear Energy Producers
-

 Misc2 weeks ago
How Hard Is It to Get Into an Ivy League School?
-

 Debt2 weeks ago
How Debt-to-GDP Ratios Have Changed Since 2000