United States
Mapped: The Top U.S. Exports by State
Article/Editing:
Click to view a larger version of the graphic.
Mapped: The Top U.S. Exports by State
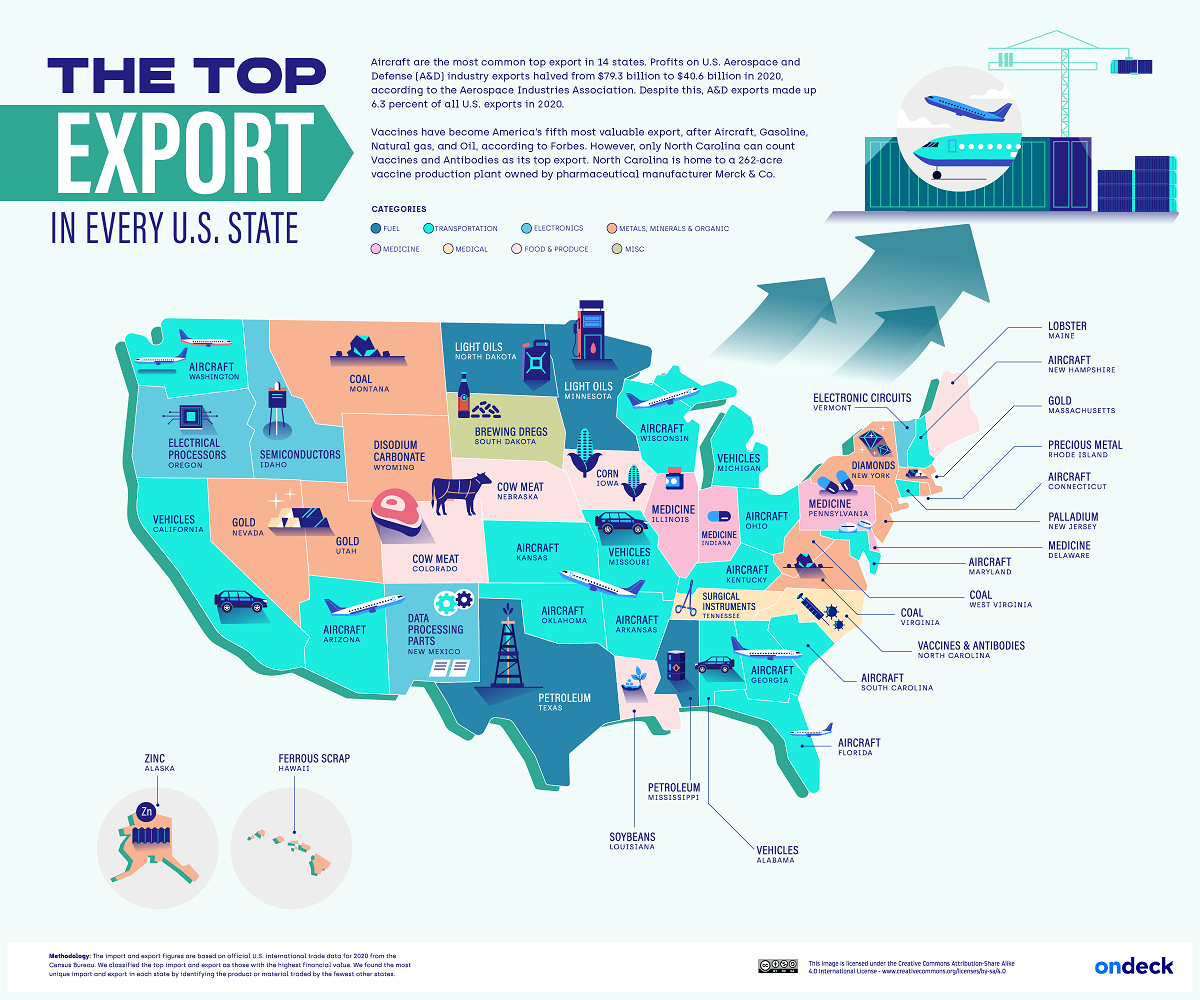
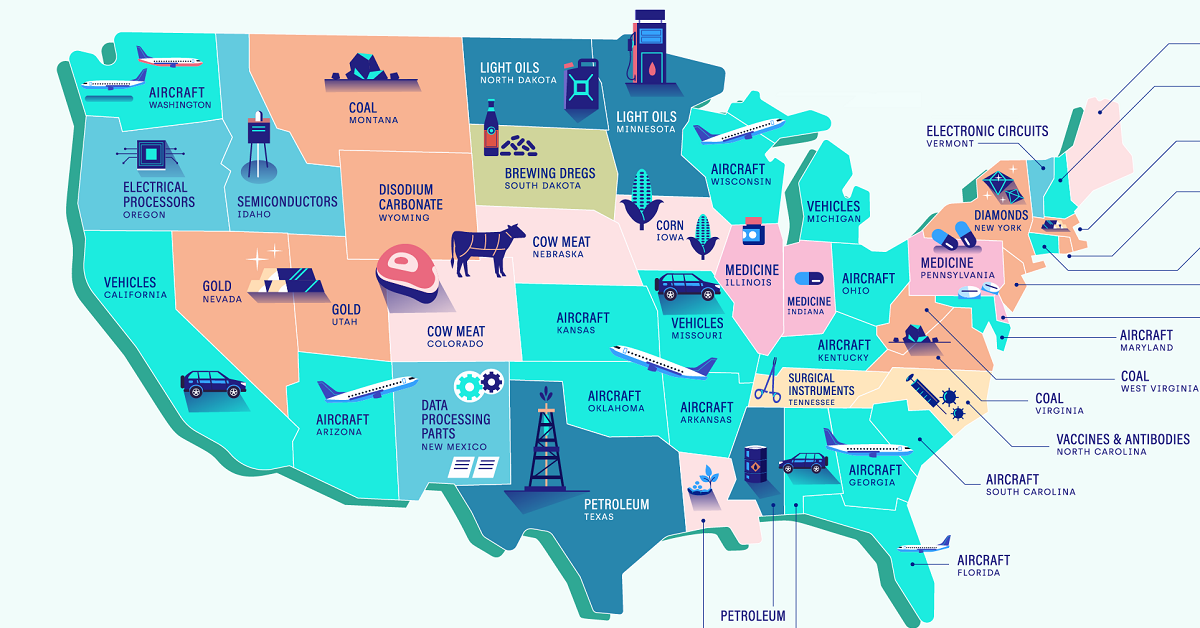
The U.S. exported over $1.3 trillion in goods in 2020, the second-highest amount worldwide.
While refined petroleum was the top export overall at $58.4 billion, aircraft exports were actually the highest across 14 states—more than any other form of export.
This infographic from OnDeck shows America’s top exports by state, using January 2022 data from the U.S. Census Bureau.
America’s Top Exports, by Category
As shown below, Florida, Kansas, and numerous other states all have aircraft (and related parts) as their top export.
Here is the top export category for each state, using 2020 figures.
| State | Top Export |
|---|---|
| Arizona | Aircraft |
| Arkansas | Aircraft |
| Connecticut | Aircraft |
| Florida | Aircraft |
| Georgia | Aircraft |
| Kansas | Aircraft |
| Kentucky | Aircraft |
| Maryland | Aircraft |
| New Hampshire | Aircraft |
| Ohio | Aircraft |
| Oklahoma | Aircraft |
| South Carolina | Aircraft |
| Washington | Aircraft |
| Wisconsin | Aircraft |
| South Dakota | Brewing Dregs |
| Montana | Coal |
| Virginia | Coal |
| West Virginia | Coal |
| Iowa | Corn |
| Colorado | Cow Meat |
| Nebraska | Cow Meat |
| New Mexico | Data Processing Parts |
| New York | Diamonds |
| Wyoming | Disodium Carbonate |
| Oregon | Electrical Processors |
| Vermont | Electronic Circuits |
| Hawaii | Ferrous Scrap |
| Massachusetts | Gold |
| Nevada | Gold |
| Utah | Gold |
| Minnesota | Light Oils |
| North Dakota | Light Oils |
| Maine | Lobster |
| Delaware | Medicine |
| Illinois | Medicine |
| Indiana | Medicine |
| Pennsylvania | Medicine |
| New Jersey | Palladium |
| Mississippi | Petroleum |
| Texas | Petroleum |
| Rhode Island | Precious Metal |
| Idaho | Semiconductors |
| Louisiana | Soybeans |
| Tennessee | Surgical Instruments |
| North Carolina | Vaccines and Antibodies |
| Alabama | Vehicles |
| California | Vehicles |
| Michigan | Vehicles |
| Missouri | Vehicles |
| Alaska | Zinc |
While the vast majority of the aerospace and defense industry consists of civil aerospace exports, America has also played a significant role in exports of military aircraft. Between 2000-2020, these were worth $99.6 billion, the highest in the world ahead of Russia’s $61.5 billion in military exports. This becomes less surprising when you consider that a new fighter jet can often come with a $100 million price tag.
But there were many different, and more interesting, exports. South Dakota’s top export is none other than brewing dregs, which is the sediment found in brewing beer. The largest importers of these dregs are Mexico, Vietnam, and South Korea. Often, dregs are sold to farmers for use in animal feed.
Meanwhile, the top export for Pennsylvania, Indiana, and Illinois is medicine, while North Carolina has vaccines and antibodies as a top export. In 2020, the U.S. exported over $46 billion in goods critical to combating COVID-19, the second-highest after China ($105 billion).
As the largest exporter of oil in America, Texas produces over 5 million barrels of oil each day, or 1.7 billion annually. Mississippi’s top export was also petroleum, while light oil was the top export in Minnesota and North Dakota. Overall, oil makes up roughly 10% of U.S. exports annually.
The Most Unique Exports, by State
While oil, medicine, and aircraft are the usual suspects for America’s top exports, here are the most idiosyncratic exports for each state. These are defined as those which are exported by the smallest number of other states.
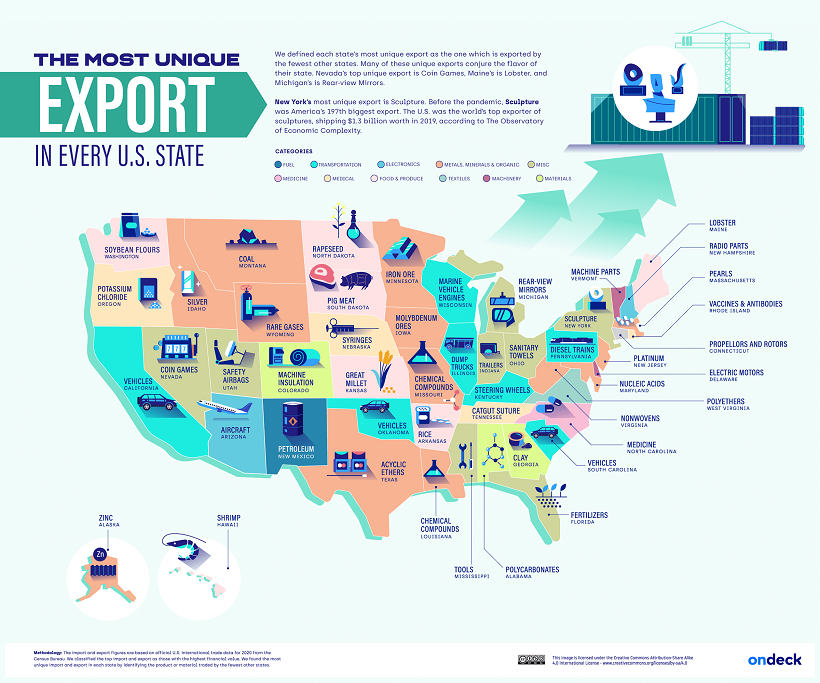
Arkansas is the top exporter of rice in America, with the industry valued at $722 million. The rice industry in Arkansas began to grow substantially in the early 1900s, and expanded even more rapidly during World War I & II.
New York, on the other hand, exports more sculptures than any other state thanks to being the epicenter of the art world. The U.S. exported over $12 billion in art and antiques in 2019.
Lobster is the most unique export in Maine, known for its characteristically large claws. The north coast of Maine offers cool waters which lend themselves to more tender and sweeter lobster fare.
Finally, Massachusetts exports quahog pearls, known for their uneven texture and mosaic pattern, found across Cape Cod.

This article was published as a part of Visual Capitalist's Creator Program, which features data-driven visuals from some of our favorite Creators around the world.


Politics
Charted: Trust in Government Institutions by G7 Countries
How much do you trust the government and its various institutions? We look at data for G7 countries for the time period of 2006-2023.


Trust in Government Institutions by G7 Countries
This was originally posted on our Voronoi app. Download the app for free on iOS or Android and discover incredible data-driven charts from a variety of trusted sources.
How much do you trust the government, and its various institutions?
It’s likely that your level of confidence probably depends on a wide range of factors, such as perceived competency, historical context, economic performance, accountability, social cohesion, and transparency.
And for these same reasons, trust levels in government institutions also change all the time, even in the world’s most developed countries: the G7.
Confidence in Government by G7 Countries (2006-2023)
This chart looks at the changes in trust in government institutions between the years 2006 and 2023, based on data from a multi-country Gallup poll.
Specifically, this dataset aggregates confidence in multiple national institutions, including the military, the judicial system, the national government, and the integrity of the electoral system.
| Country | Confidence (2006) | Confidence (2023) | Change (p.p.) |
|---|---|---|---|
| Canada | 57% | 64% | +7 |
| Britain | 63% | 63% | +0 |
| Germany | 55% | 61% | +6 |
| France | 54% | 60% | +6 |
| Japan | 48% | 59% | +11 |
| Italy | 41% | 54% | +13 |
| United States | 63% | 50% | -13 |
What’s interesting here is that in the G7, a group of the world’s most developed economies, there is only one country bucking the general trend: the United States.
Across most G7 countries, confidence in institutions has either improved or stayed the same between 2006 and 2023. The largest percentage point (p.p.) increases occur in Italy and Japan, which saw +13 p.p. and +11 p.p. increases in trust over the time period.
In the U.S., however, confidence in government institutions has fallen by 13 p.p. over the years. What happened?
Key Figures on U.S. Trust in Institutions
In 2006, the U.S. was tied with the UK as having the highest confidence in government institutions, at 63%.
But here’s where the scores stand in 2023, across various institutions:
| 🇺🇸 Institutions | Confidence (2023) |
|---|---|
| Military | 81% |
| Judiciary | 42% |
| National Government | 30% |
| Elections | 44% |
| Overall | 49% |
Based on this data, it’s clear that the U.S. lags behind in three key indicators: confidence in the national government, confidence in the justice system, and confidence in fair elections. It ranked in last place for each indicator in the G7.
One other data point that stands out: despite leading the world in military spending, the U.S. is only the third most confident in its military in the G7. It lags behind France (86%) and the United Kingdom (83%).

-

 Technology6 days ago
All of the Grants Given by the U.S. CHIPS Act
-

 Uranium2 weeks ago
The World’s Biggest Nuclear Energy Producers
-

 Education2 weeks ago
How Hard Is It to Get Into an Ivy League School?
-

 Debt2 weeks ago
How Debt-to-GDP Ratios Have Changed Since 2000
-

 Sports2 weeks ago
The Highest Earning Athletes in Seven Professional Sports
-

 Science2 weeks ago
Visualizing the Average Lifespans of Mammals
-

 Brands1 week ago
How Tech Logos Have Evolved Over Time
-

 Energy1 week ago
Ranked: The Top 10 EV Battery Manufacturers in 2023