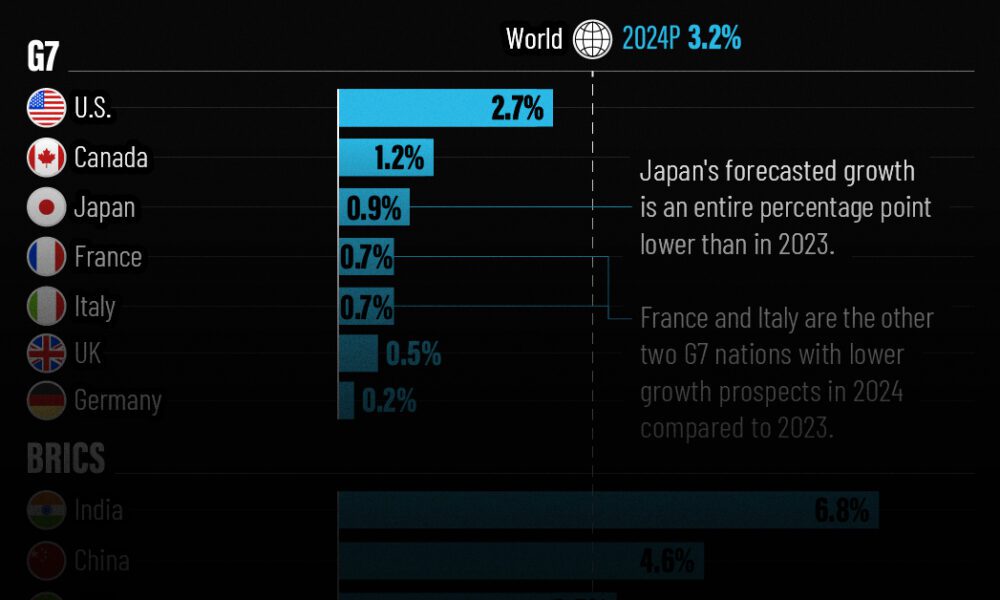
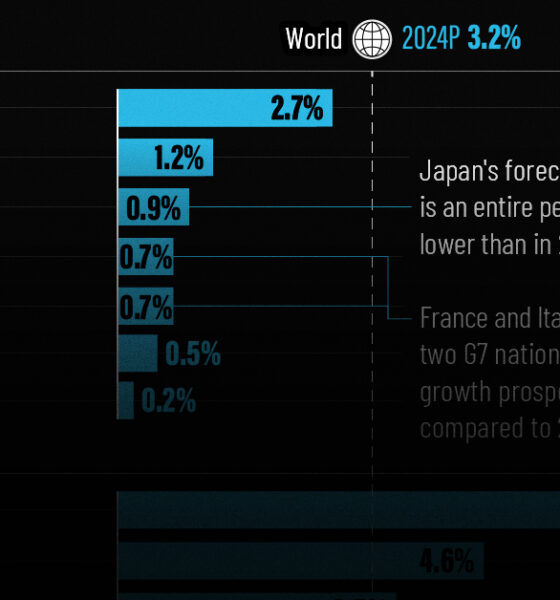
The IMF has released its economic growth forecasts for 2024. How do the G7 and BRICS countries compare?
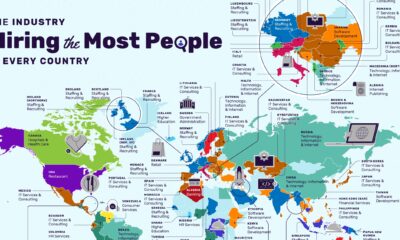

The restaurant industry has the most vacancies in the U.S., followed by non-profit organizations.


Global inflation projections look optimistic in 2024, but risks of a second wave of price pressures remain due to geopolitical shocks.


Here are the largest cocoa producing countries globally—from Côte d'Ivoire to Brazil—as cocoa prices hit record highs.
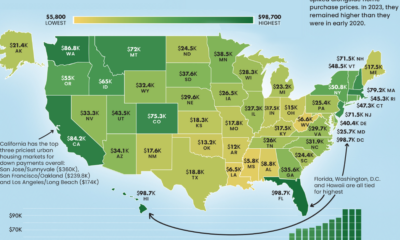

From coast to coast, the median down payment on a single family home can be close to $100,000 or less than $10,000.
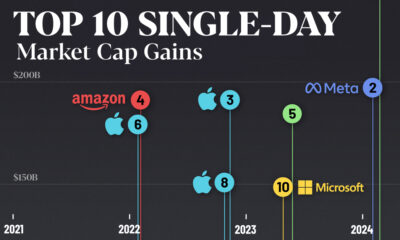

Nvidia broke the record for the largest single-day market cap gains after adding nearly $250B on Feb. 22, 2024.
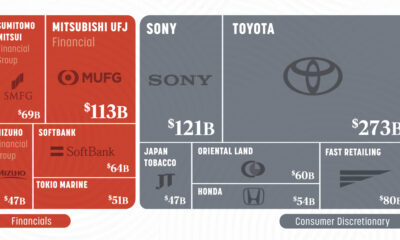

Japan’s top 25 corporations are worth a combined $2 trillion.
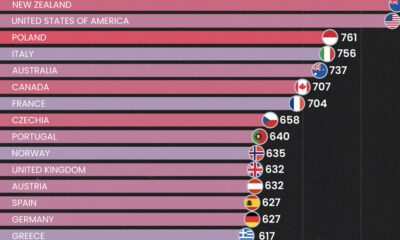

Here are the highest vehicles per capita by country as a growing global middle class is fueling car ownership rates around the world.


LVMH Moët Hennessy Louis Vuitton (LVMH) is the industry’s biggest player by a wide margin.


Will global GDP growth continue to be resilient in 2024? This graphic shows the economic outlook for 191 economies around the world.
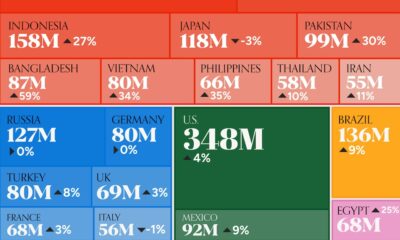

We visualize the 20 largest consumer markets in the world in 2030—from Asian giants to North and South American powerhouses.


 Creator Program