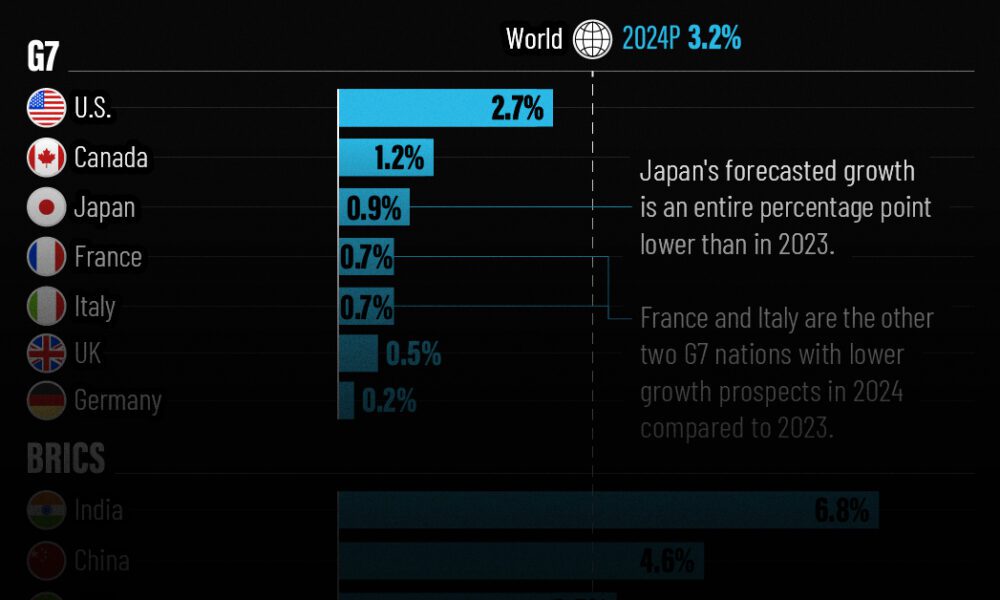
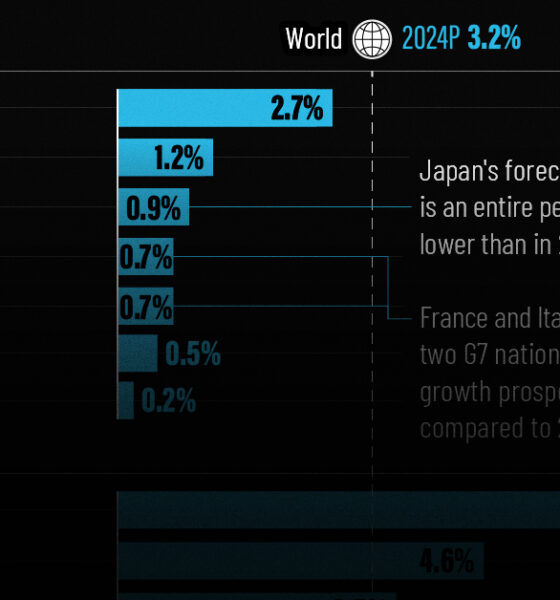
The IMF has released its economic growth forecasts for 2024. How do the G7 and BRICS countries compare?


Which of the Big Four accounting firms take home the most audit fees from their S&P 500 clients?
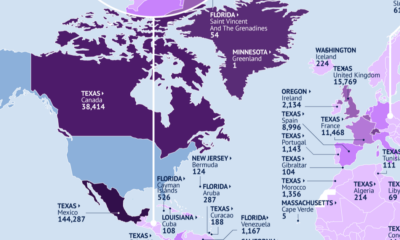

This map identifies the biggest U.S. export markets by state, showing the top partner of each country by value of goods imported.


Last year, the share of affordable homes in the U.S. reached its lowest point on record amid high interest rates and soaring home prices.


We compare America's top 10 companies by revenue in 1994 and 2023 to see how the business landscape has changed.


In this graphic, we illustrate the top ten emerging markets according to their foreign direct investment (FDI) momentum in 2024.
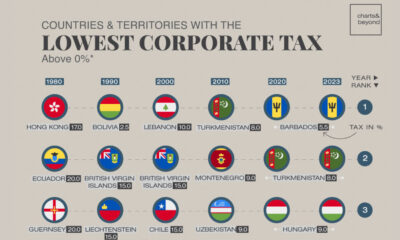

Many countries with the lowest corporate tax rates are clustered in Europe and Asia, with tax rates far below the global average.
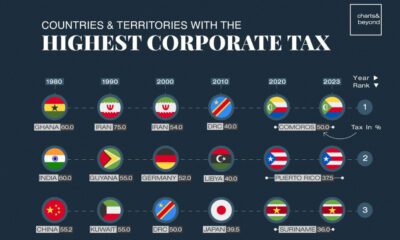

The world's top corporate tax rate stands at 50%, far higher than the global average. Here are the top 10 countries with the highest rates.


Korean brands dominate the U.S. TV market.
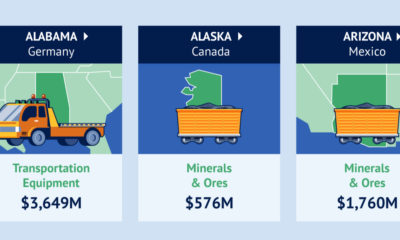

Canada is the top destination for products from 21 states.


As U.S. home prices hit record highs, which housing market is seen the fastest growth? This graphic shows the top 10 across the country.


 Creator Program