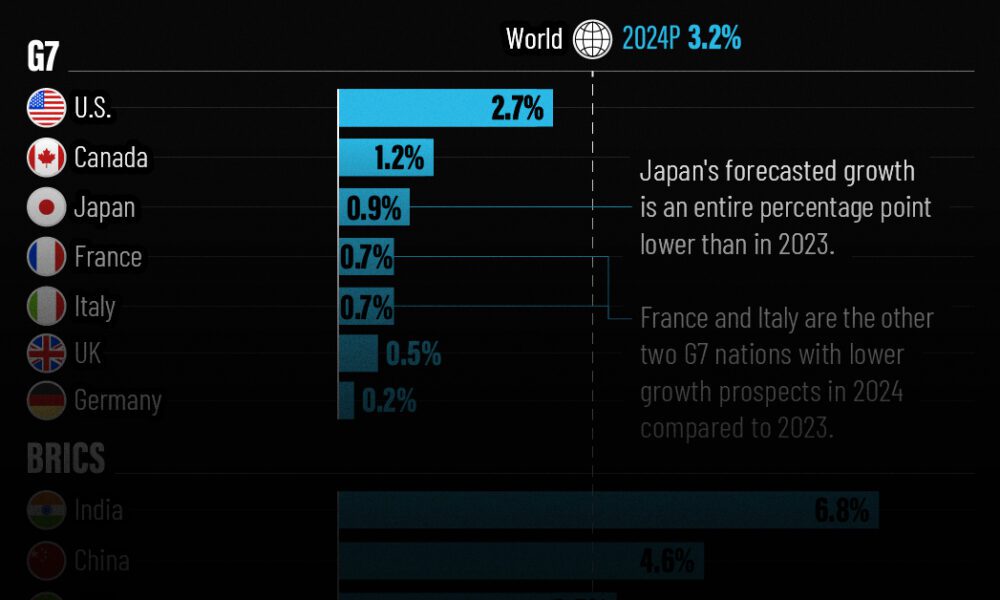
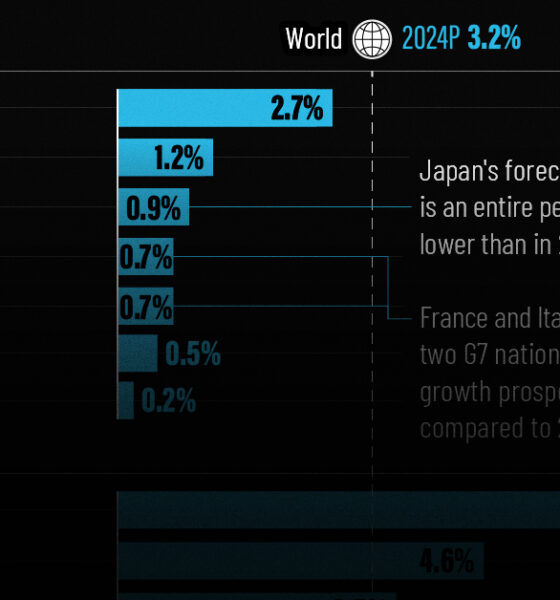
The IMF has released its economic growth forecasts for 2024. How do the G7 and BRICS countries compare?
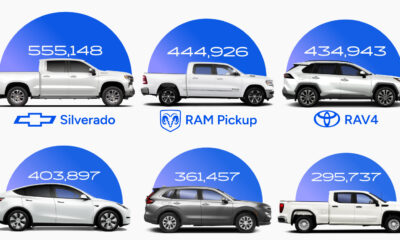

In 2023, nine of the top 10 best-selling vehicles in America were trucks or SUVs. This graphic shows the most popular vehicles overall.
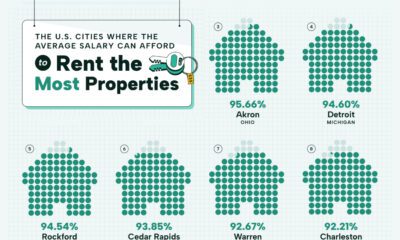

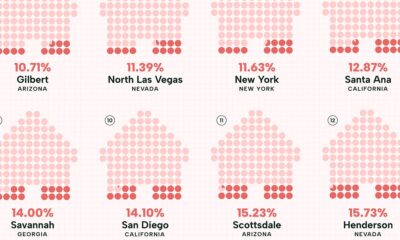
Visualizing the most affordable U.S. cities for renters by the percentage of affordable rentals available on an average salary.

Visualizing the least affordable U.S. cities for renters by the percentage of affordable rentals available on an average salary.


This graphic illustrates Panama Canal traffic by shipment category, looking at the total number of shipping crossings and the total tonnage.


This graphic visualizes the most valuable brands by country in 12 major economies, from tech and energy giants to automakers and banks.

Jin Medical, the top IPO of the year, is set to be delisted due to a listing rule violation.
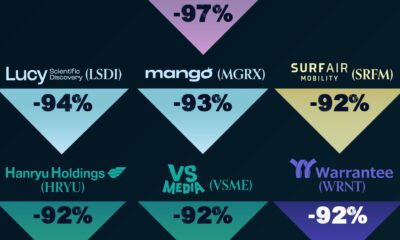

The Chinese EV battery company U Power experienced the worst IPO performance in 2023.


This visualization looks at how past interest rate cut cycles have gone and the rate cut forecasts by top institutions for 2024.
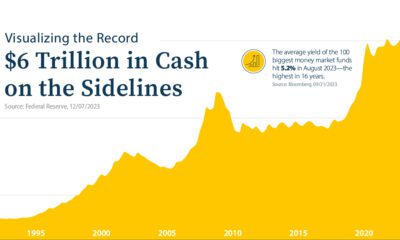

Assets in money market funds are at all-time highs. But as investors stockpile cash, are they missing out on today's stock market rally?
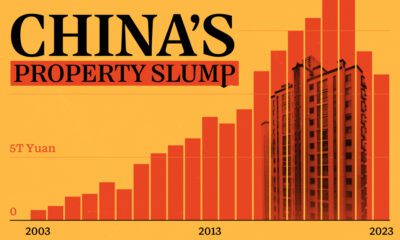

These charts show China's real estate boom in the 21st century and the subsequent slowdown since 2022.


 Creator Program