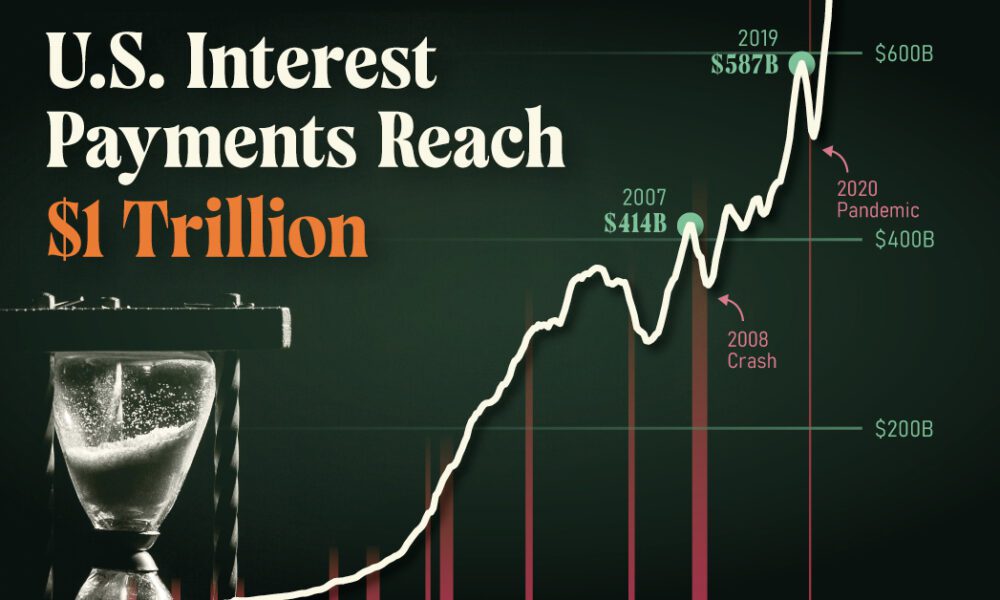
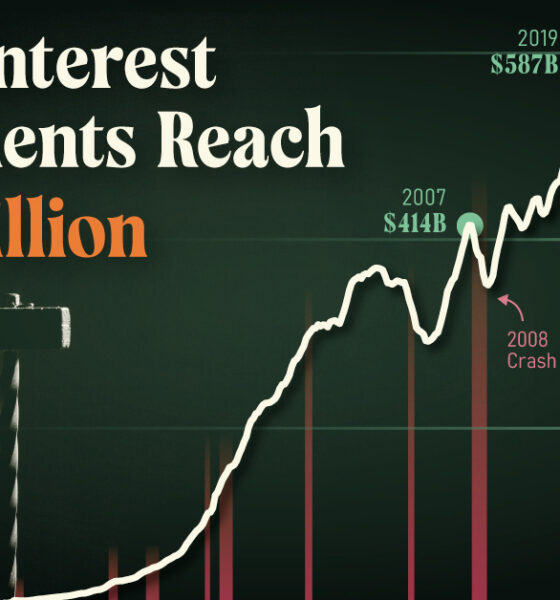
U.S. debt interest payments have surged past the $1 trillion dollar mark, amid high interest rates and an ever-expanding debt...
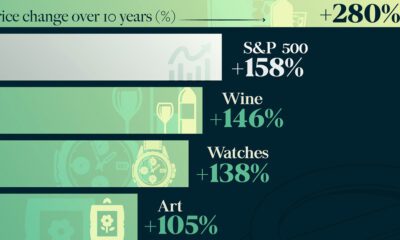

How does investing in luxury goods like expensive watches and rare whisky compare to other goods, or to the S&P 500?
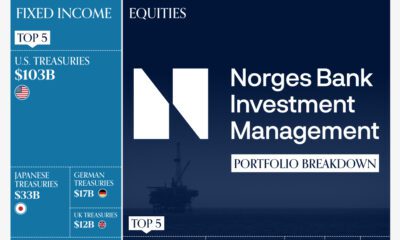

This graphic breaks down the portfolio of the world's largest sovereign wealth fund, valued at $1.4 trillion.


The 12 worst investment funds have destroyed $56 billion in shareholder wealth over the past decade, as of Dec. 2023.


With trillion dollar valuations becoming more common, we've compared the five biggest companies by stock exchange.


We visualize the recent performance of the Magnificent Seven stocks, uncovering a clear divergence between the group's top and bottom names.


This graphic illustrates the size of the top 20 Chinese stocks, along with their 1-year return as of March 2024.


Sovereign wealth funds have scaled up their green investments in the push towards decarbonizing the global economy.
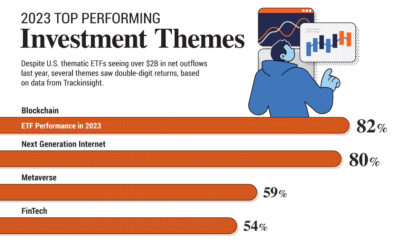

In 2023, several investment themes outperformed the S&P 500 by a wide margin. Here are the top performers—from blockchain to AI.
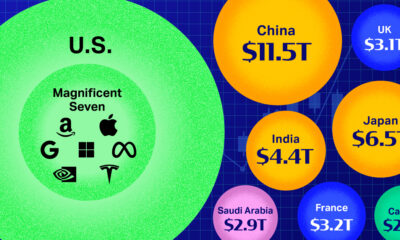

This graphic illustrates the biggest stock markets by country, providing a unique breakdown of $110 trillion in valuation.
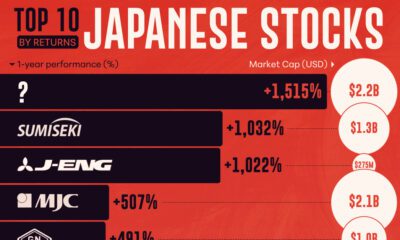

With the Nikkei 225 hitting its first all-time high since 1989, we've ranked the top 10 Japanese stocks by their 1-yr return.