Markets
Mapped: The Median Down Payment for a House, by U.S. State
Article/Editing:
![]() See this visualization first on the Voronoi app.
See this visualization first on the Voronoi app.
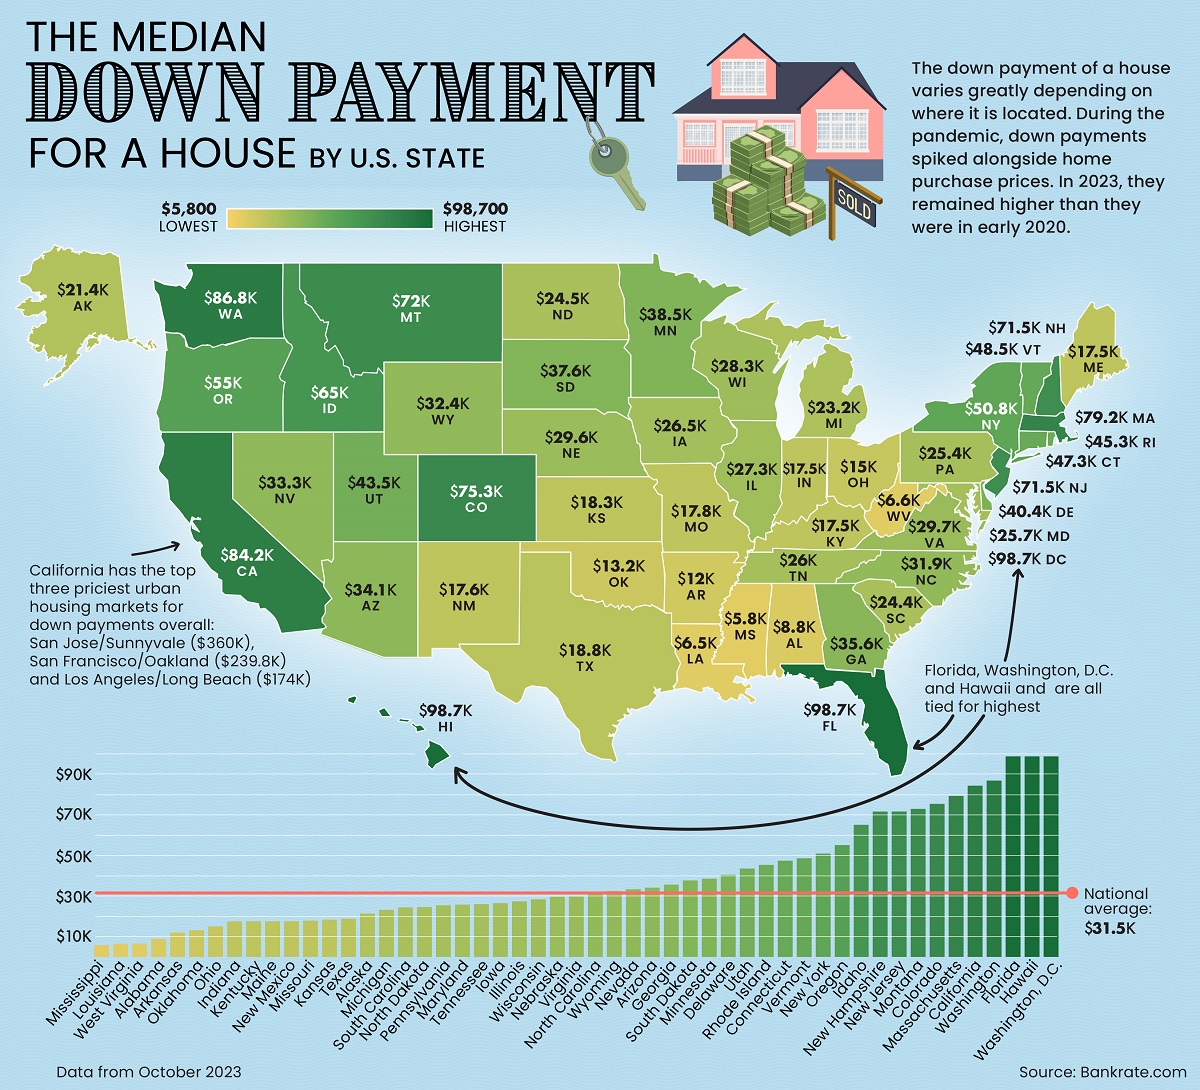
The Median Down Payment for a House, by U.S. State
This was originally posted on our Voronoi app. Download the app for free on iOS or Android and discover incredible data-driven charts from a variety of trusted sources.
Since housing costs vary across U.S. states, so too does the income required to buy a house, and the down payment associated with the purchase.
But how much does the median value change per state?
Creator Julie Peasley maps the median down payment on a single-family home by U.S. state, using data from Realtor.com, accessed through Bankrate, a publisher and rate comparison service focused on the banking industry.
Importantly, a “single-family home” is legally defined as a “structure used as a single-dwelling unit,” which includes:
- No common walls
- Built on its own parcel of land
- Private entrance/exit
- One set of utilities
- Single kitchen
This means actual house square footage will vary within and across the states, affecting the median prices and down payments in this data.
The Data: Median Down Payments by State
The top three priciest places for down payments are tied for number one: Washington D.C., Florida, and Hawaii, at a whopping $98,670.
| Rank | U.S. State | Median Down Payment | Average Down Payment Percentage |
|---|---|---|---|
| 1 | Florida | $98,670 | 17.0% |
| 2 | Hawaii | $98,670 | 17.0% |
| 3 | Washington, D.C. | $98,670 | 20.9% |
| 4 | Washington | $86,752 | 28.6% |
| 5 | California | $84,244 | 18.4% |
| 6 | Massachusetts | $79,206 | 18.9% |
| 7 | Colorado | $75,304 | 18.5% |
| 8 | Montana | $72,833 | 21.0% |
| 9 | New Jersey | $71,547 | 18.0% |
| 10 | New Hampshire | $71,500 | 20.0% |
| 11 | Idaho | $64,985 | 20.2% |
| 12 | Oregon | $55,015 | 17.3% |
| 13 | New York | $50,843 | 17.0% |
| 14 | Vermont | $48,534 | 17.5% |
| 15 | Connecticut | $47,342 | 18.6% |
| 16 | Rhode Island | $45,285 | 16.6% |
| 17 | Utah | $43,488 | 16.4% |
| 18 | Delaware | $40,412 | 17.0% |
| 19 | Minnesota | $38,500 | 16.1% |
| 20 | South Dakota | $37,630 | 16.8% |
| 21 | Georgia | $35,572 | 15.9% |
| 22 | Arizona | $34,072 | 15.4% |
| 23 | Nevada | $33,306 | 15.0% |
| 24 | Wyoming | $32,389 | 16.0% |
| 25 | North Carolina | $31,867 | 14.5% |
| 26 | Virginia | $29,704 | 13.5% |
| 27 | Nebraska | $29,617 | 15.4% |
| 28 | Wisconsin | $28,333 | 15.0% |
| 29 | Illinois | $27,348 | 14.3% |
| 30 | Iowa | $26,461 | 15.5% |
| 31 | Tennessee | $25,969 | 14.6% |
| 32 | Maryland | $25,723 | 11.9% |
| 33 | Pennsylvania | $25,402 | 13.8% |
| 34 | North Dakota | $24,543 | 15.0% |
| 35 | South Carolina | $24,357 | 15.1% |
| 36 | Michigan | $23,153 | 14.2% |
| 37 | Alaska | $21,354 | 12.2% |
| 38 | Texas | $18,780 | 12.2% |
| 39 | Kansas | $18,325 | 13.1% |
| 40 | Missouri | $17,832 | 12.9% |
| 41 | New Mexico | $17,576 | 12.6% |
| 42 | Kentucky | $17,548 | 13.4% |
| 43 | Maine | $17,548 | 16.0% |
| 44 | Indiana | $17,477 | 12.6% |
| 45 | Ohio | $15,044 | 12.3% |
| 46 | Oklahoma | $13,177 | 12.3% |
| 47 | Arkansas | $11,996 | 11.8% |
| 48 | Alabama | $8,788 | 10.7% |
| 49 | West Virginia | $6,611 | 9.2% |
| 50 | Louisiana | $6,470 | 9.2% |
| 51 | Mississippi | $5,814 | 9.3% |
| N/A | National | $31,500 | 15.0% |
Note: Current as of Q3, 2023.
Ranked 4th and 5th are Washington State and California, requiring median down payments in the mid-$80,000s.
Unsurprisingly the median down payment patterns follow how expensive housing is in that particular state, which in itself is a reflection of jobs, income, population, amenities, and the desirability of the location. By looking at the median, it also cuts out the “high end” that would skew the average (mean) payment higher.
At the bottom of the list, Alabama, West Virginia, Louisiana, and Mississippi all average less than $10,000 in median down payments.
However looking at the percentage of the total value put down as a down payment in those states (10%) indicates homebuyers there tend to have longer repayment plans. This is in contrast to the median down payment in Washington, which is close to one-third of the total house value.
Work From Home and U.S. Real Estate
The U.S. housing market has seen quite an upheaval in the last few years. Between December 2019 and November 2021, house prices rose nearly 24%, the fastest rate on record. Research found that areas that were more exposed to remote work experienced higher price growth.
Following the trend of skyrocketing house prices, the national average for down payments has also more than doubled from $13,250 in Q1 2020 to $31,500 in Q3, 2023, per earlier linked Bankrate data.
Rents have also climbed significantly, pricing many young adults out of moving out of their parents homes, which in turn has fueled luxury spending with more disposable income.
On the other hand, the commercial real estate market has struggled with falling demand and higher interest rates, putting downward pressure on prices in the sector.

This article was published as a part of Visual Capitalist's Creator Program, which features data-driven visuals from some of our favorite Creators around the world.


Economy
Economic Growth Forecasts for G7 and BRICS Countries in 2024
The IMF has released its economic growth forecasts for 2024. How do the G7 and BRICS countries compare?


G7 & BRICS Real GDP Growth Forecasts for 2024
The International Monetary Fund’s (IMF) has released its real gross domestic product (GDP) growth forecasts for 2024, and while global growth is projected to stay steady at 3.2%, various major nations are seeing declining forecasts.
This chart visualizes the 2024 real GDP growth forecasts using data from the IMF’s 2024 World Economic Outlook for G7 and BRICS member nations along with Saudi Arabia, which is still considering an invitation to join the bloc.
Get the Key Insights of the IMF’s World Economic Outlook
Want a visual breakdown of the insights from the IMF’s 2024 World Economic Outlook report?
This visual is part of a special dispatch of the key takeaways exclusively for VC+ members.
Get the full dispatch of charts by signing up to VC+.
Mixed Economic Growth Prospects for Major Nations in 2024
Economic growth projections by the IMF for major nations are mixed, with the majority of G7 and BRICS countries forecasted to have slower growth in 2024 compared to 2023.
Only three BRICS-invited or member countries, Saudi Arabia, the UAE, and South Africa, have higher projected real GDP growth rates in 2024 than last year.
| Group | Country | Real GDP Growth (2023) | Real GDP Growth (2024P) |
|---|---|---|---|
| G7 | 🇺🇸 U.S. | 2.5% | 2.7% |
| G7 | 🇨🇦 Canada | 1.1% | 1.2% |
| G7 | 🇯🇵 Japan | 1.9% | 0.9% |
| G7 | 🇫🇷 France | 0.9% | 0.7% |
| G7 | 🇮🇹 Italy | 0.9% | 0.7% |
| G7 | 🇬🇧 UK | 0.1% | 0.5% |
| G7 | 🇩🇪 Germany | -0.3% | 0.2% |
| BRICS | 🇮🇳 India | 7.8% | 6.8% |
| BRICS | 🇨🇳 China | 5.2% | 4.6% |
| BRICS | 🇦🇪 UAE | 3.4% | 3.5% |
| BRICS | 🇮🇷 Iran | 4.7% | 3.3% |
| BRICS | 🇷🇺 Russia | 3.6% | 3.2% |
| BRICS | 🇪🇬 Egypt | 3.8% | 3.0% |
| BRICS-invited | 🇸🇦 Saudi Arabia | -0.8% | 2.6% |
| BRICS | 🇧🇷 Brazil | 2.9% | 2.2% |
| BRICS | 🇿🇦 South Africa | 0.6% | 0.9% |
| BRICS | 🇪🇹 Ethiopia | 7.2% | 6.2% |
| 🌍 World | 3.2% | 3.2% |
China and India are forecasted to maintain relatively high growth rates in 2024 at 4.6% and 6.8% respectively, but compared to the previous year, China is growing 0.6 percentage points slower while India is an entire percentage point slower.
On the other hand, four G7 nations are set to grow faster than last year, which includes Germany making its comeback from its negative real GDP growth of -0.3% in 2023.
Faster Growth for BRICS than G7 Nations
Despite mostly lower growth forecasts in 2024 compared to 2023, BRICS nations still have a significantly higher average growth forecast at 3.6% compared to the G7 average of 1%.
While the G7 countries’ combined GDP is around $15 trillion greater than the BRICS nations, with continued higher growth rates and the potential to add more members, BRICS looks likely to overtake the G7 in economic size within two decades.
BRICS Expansion Stutters Before October 2024 Summit
BRICS’ recent expansion has stuttered slightly, as Argentina’s newly-elected president Javier Milei declined its invitation and Saudi Arabia clarified that the country is still considering its invitation and has not joined BRICS yet.
Even with these initial growing pains, South Africa’s Foreign Minister Naledi Pandor told reporters in February that 34 different countries have submitted applications to join the growing BRICS bloc.
Any changes to the group are likely to be announced leading up to or at the 2024 BRICS summit which takes place October 22-24 in Kazan, Russia.
Get the Full Analysis of the IMF’s Outlook on VC+
This visual is part of an exclusive special dispatch for VC+ members which breaks down the key takeaways from the IMF’s 2024 World Economic Outlook.
For the full set of charts and analysis, sign up for VC+.

-

 Education1 week ago
How Hard Is It to Get Into an Ivy League School?
-

 Technology2 weeks ago
Ranked: Semiconductor Companies by Industry Revenue Share
-

 Markets2 weeks ago
Ranked: The World’s Top Flight Routes, by Revenue
-

 Demographics2 weeks ago
Population Projections: The World’s 6 Largest Countries in 2075
-

 Markets2 weeks ago
The Top 10 States by Real GDP Growth in 2023
-

 Demographics2 weeks ago
The Smallest Gender Wage Gaps in OECD Countries
-

 Economy2 weeks ago
Where U.S. Inflation Hit the Hardest in March 2024
-

 Environment2 weeks ago
Top Countries By Forest Growth Since 2001