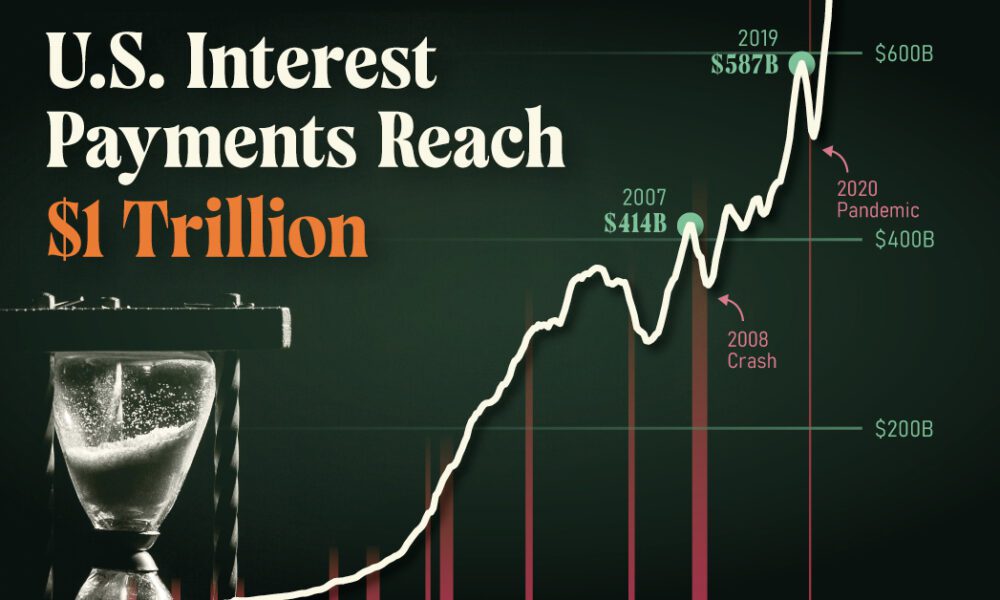
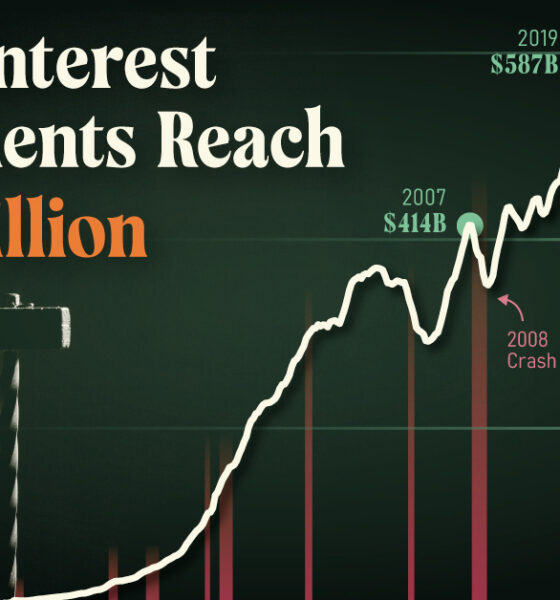
U.S. debt interest payments have surged past the $1 trillion dollar mark, amid high interest rates and an ever-expanding debt...


Using our database of 700+ forecasts from reports, articles, interviews, and more, we highlight what experts think will happen in 2024.
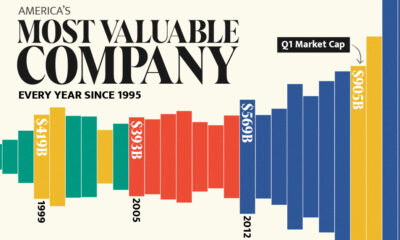

Over the last three decades, the growth of tech companies has driven a shift in the ranking of the most valuable companies in the U.S.


Commercial jet purchases boomed in 2023. Here are the top airlines that ordered aircraft amid surging travel demand last year.


The forecasted number of U.S. subscribers on major streaming platforms in 2027 shows that Prime Video will be the most popular by a wide margin.


Here are global risk projections for 2024 as tensions in the Middle East escalate and major economies face elections this year.
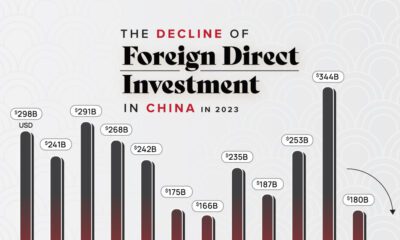

Geopolitical tensions, the closure of due diligence firms, and falling offshore IPOs lead to declining Chinese FDI Inflows.


Commodity returns in 2023 took a hit. This graphic shows the performance of commodities like gold, oil, nickel, and corn over the last decade.
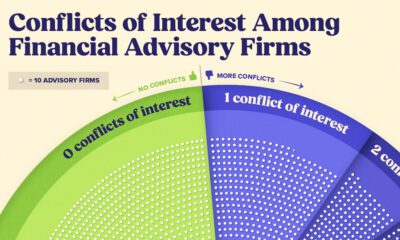

Financial advisors may not always act in your best interest. How common are conflicts of interest among U.S. firms?


Companies benefitting from the AI train and strong retail demand helped their individual S&P 500 sector performance in 2023.


Between equities, real estate, commodities, bonds, and emerging markets, we track which major asset class ended the year on a positive note.


 Creator Program