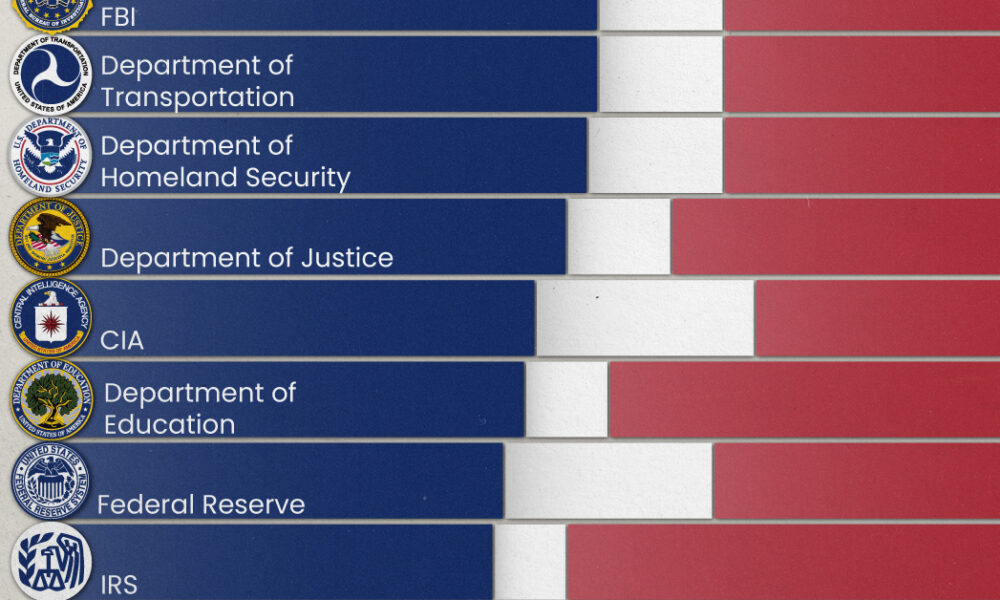
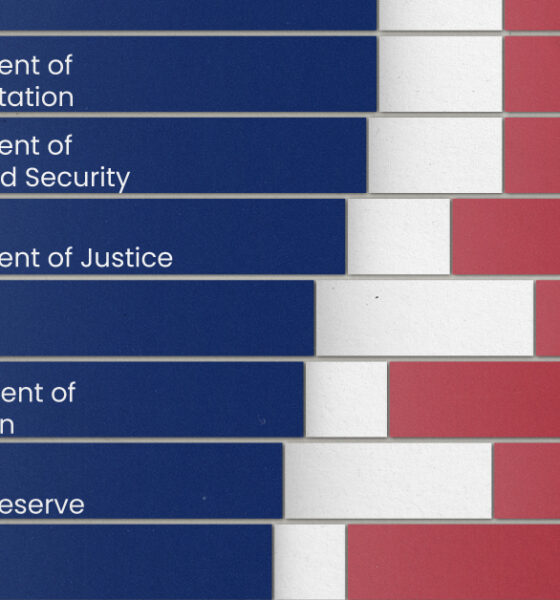
Fourteen of 16 federal government agencies garnered more favorable responses than unfavorable ones. But what were the outliers?
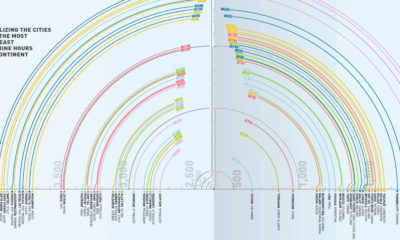

While we all see the same sky, some see it differently, depending on where they live. Today's graphic ranks world cities by annual hours of sunshine.
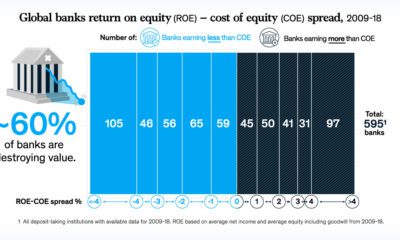

As we enter a late-cycle economy, a staggering 60% of banks are destroying value. Here’s the steps they can take in order to succeed.
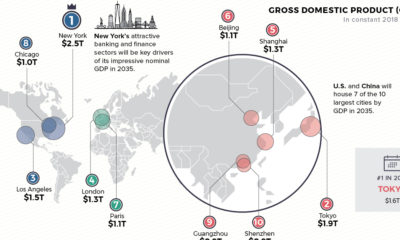

Cities are heavy hitters in the global economy. Where will the top 10 cities be in 2035—based on GDP, population, and annual growth?
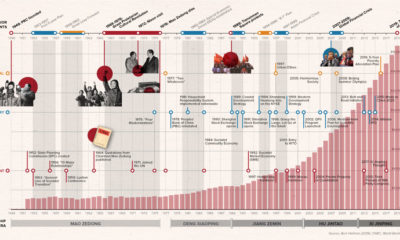

How did China go from agrarian economy to global superpower? This timeline covers the key events and policies that shaped the PRC over its 70-year history.
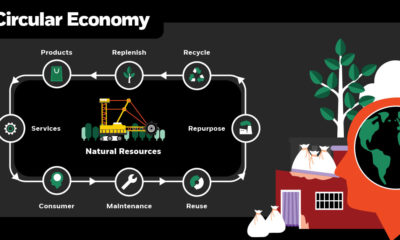

Our modern world was designed for mass consumption and waste. Choosing to build a circular economy will be integral to the future of our planet.
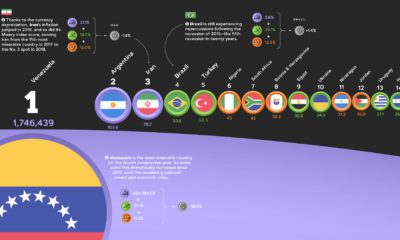

The annual Misery Index ranks the most and least miserable countries, based on four economic factors—unemployment, inflation, lending rates, and GDP growth.
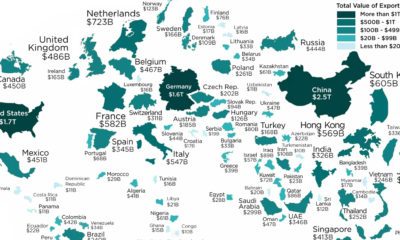

These are the largest international trade powerhouses of the world, resized on the map based on their annual exports in 2018.
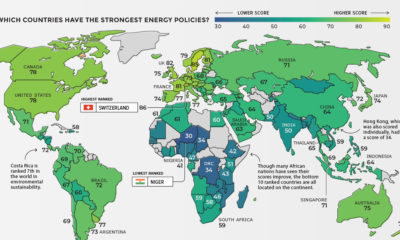

Which countries are able to balance prosperity and sustainability in their energy mixes? See the countries with the most sustainable energy policies.


After adjusting GDP for purchasing power parity (PPP), here is how the composition of the world economy breaks down by country.
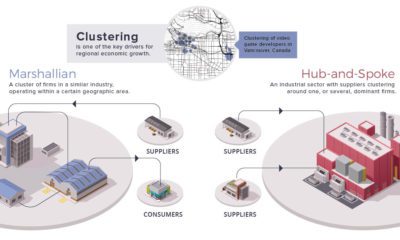

Economies create distinct spatial patterns. This week's chart visualizes the relationships businesses and industry imprint on the urban environment.


