
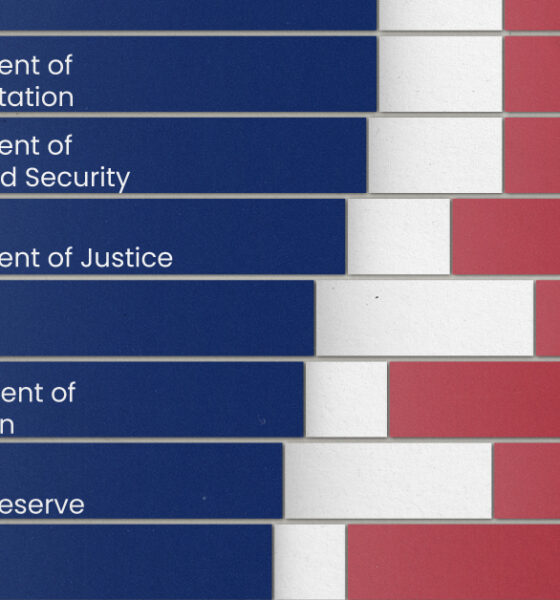
Fourteen of 16 federal government agencies garnered more favorable responses than unfavorable ones. But what were the outliers?
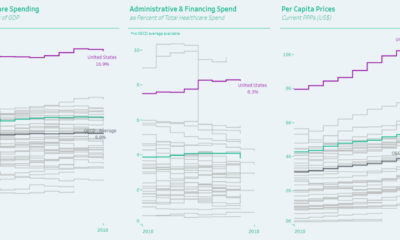

Healthcare spending can be measured as a proportion of GDP, by admin costs, and per capita—and the United States comes in first in every category.
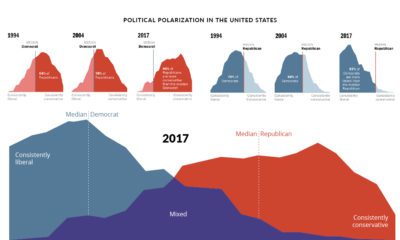

Since 1994, the political divide in the United States has only become more extreme. How have American feelings across major issues evolved over time?
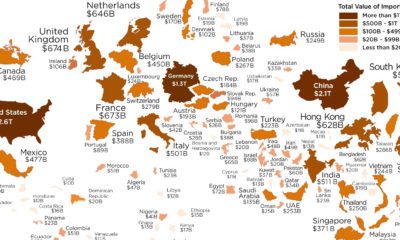

Which economies are the world's biggest importers of goods? See for yourself in this visualization, which resizes countries based on the value of imports.
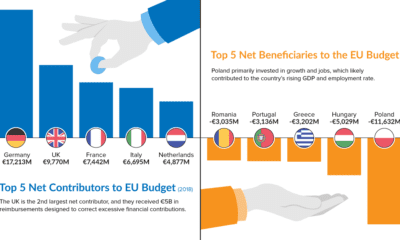

As Brexit looms, the EU budget is under the microscope. Learn which countries contribute the most—and least—to the bottom line in this chart.
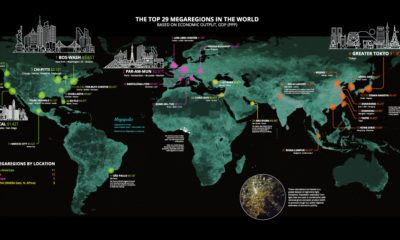

Today’s stunning map ranks the world’s most powerful megaregions — together, they contribute a whopping $28 trillion to the global economy.


This infographic explores how China’s proposed social credit system will monitor and surveil citizens, and how it'll be used to reward or punish them.
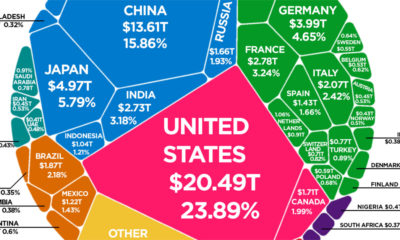

According to the latest World Bank data, the global economy is now $85.8 trillion in nominal terms. Here's how it breaks down.
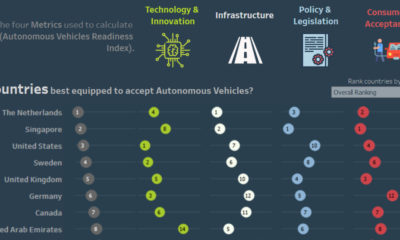

This interactive visual shows the countries best prepared for the shift to autonomous vehicles, as well as the associated societal and economic impacts.
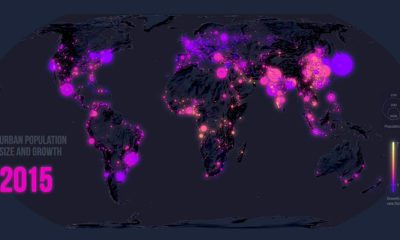

Few global trends have matched the profound impact of urbanization. Today’s map looks back at 70 years of movement in over 1,800 cities.
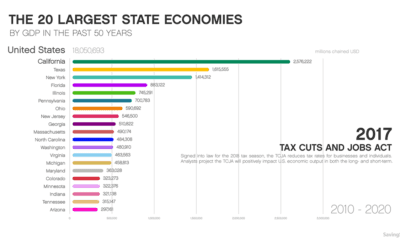

This animation shows how the largest state economies by GDP have changed over the last five decades of time, and what such a ranking looks like...


