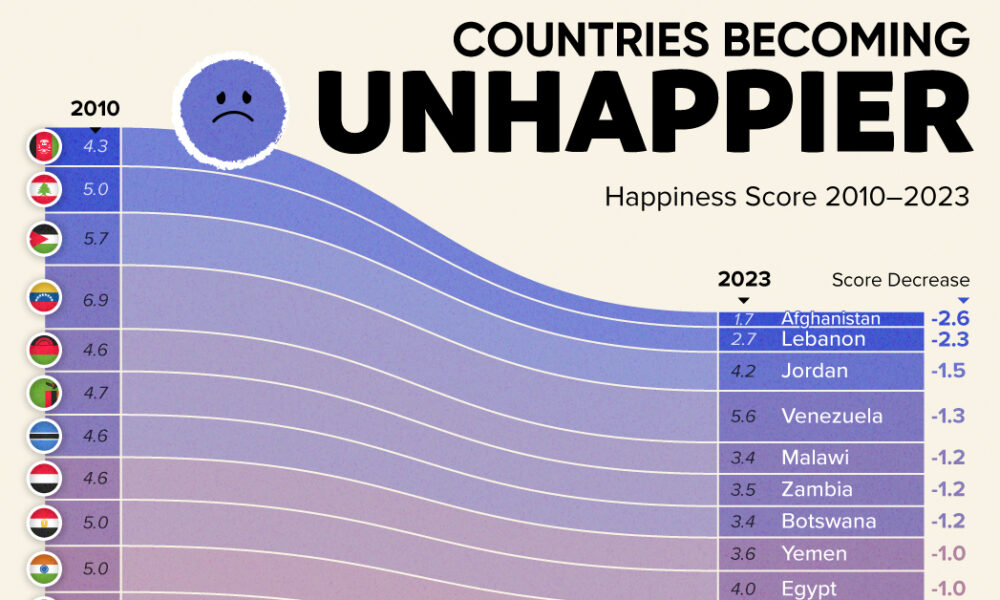
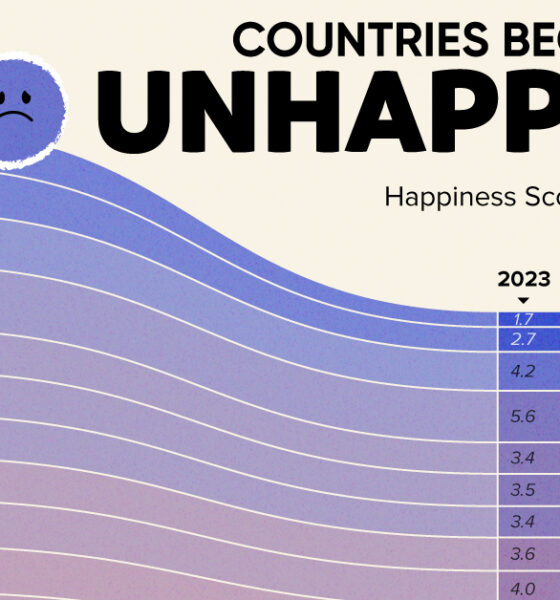
Tracking Gallup survey data for more than a decade reveals some countries are witnessing big happiness declines, reflecting their shifting...

What does population density look like on a global scale? These detailed 3D renders illustrate our biggest urban areas and highlight population trends.
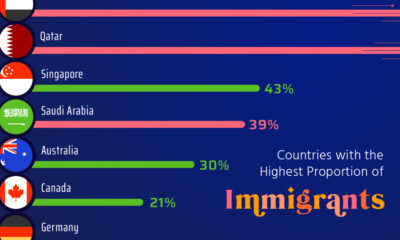

Here, we highlight countries that are magnets for immigration, such as UAE and Qatar, as well as nations with very few foreign born residents.
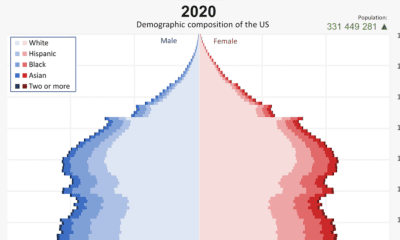

From 1901 to 2020, the U.S. population has changed significantly. This video reveals the change in America's demographics over 100+ years.
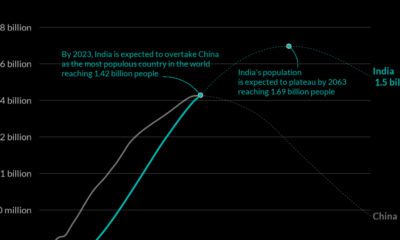

India's population growth is happening faster than predicted. The country will overtake China as the world’s most populated country in 2023.


Which brands win the most with Gen Z compared to older generations? From TikTok to Capri Sun, this ranking looks at Gen Z's favorite brands.
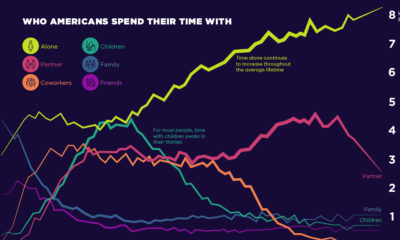

Social connections evolve throughout our lifetimes. Here we chart how much time Americans spend with others, and who that time is spent with.
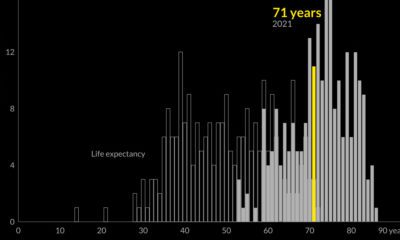

Global life expectancy has been increasing worldwide over the last 70 years. But how does the picture break down by region and by sex?
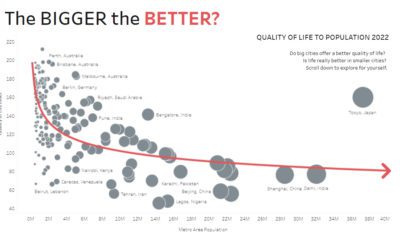

Are big cities all they’re cracked up to be? These interactive charts about population size question whether bigger always equals better.
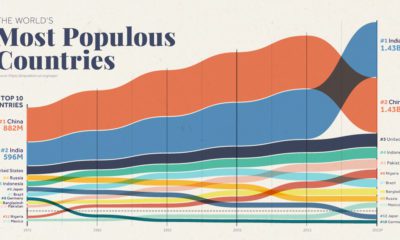

Over the past 50 years, the world's population has doubled, and there have been big changes in the ranking of the world's most populous countries
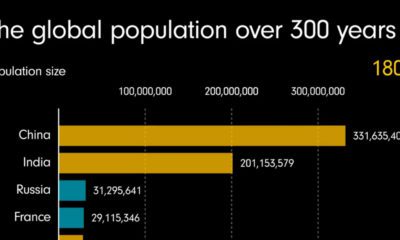

This animated video shows how much the population has grown over the last three centuries, and which regions have driven this growth.