Demographics
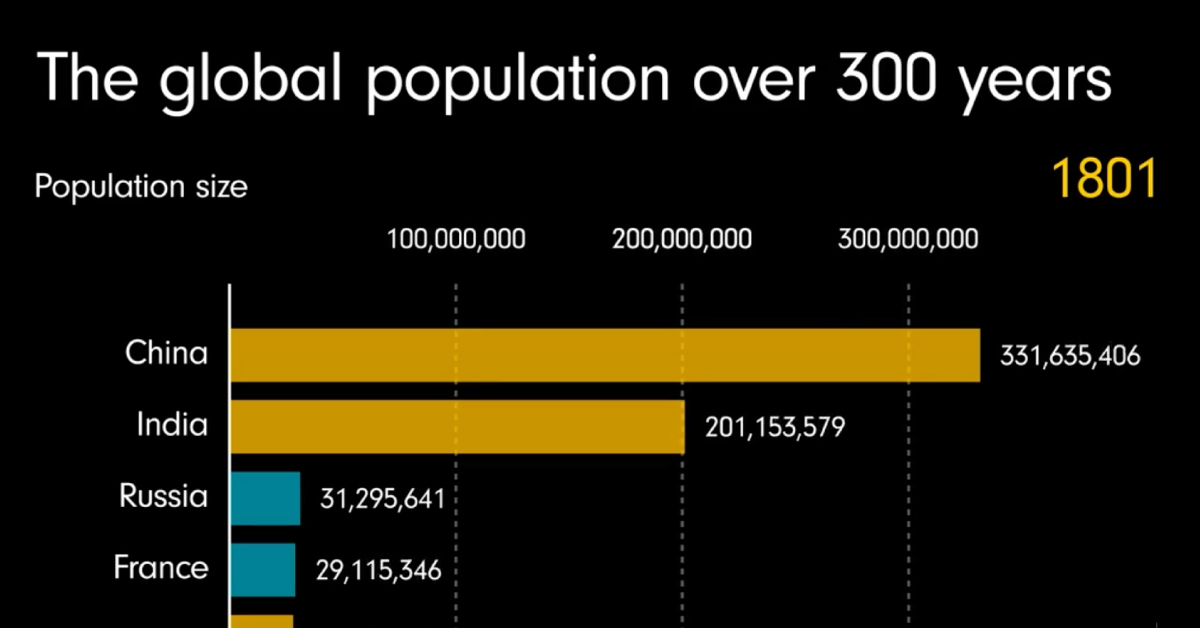
Animation: The Global Population Over 300 Years, by Country
Article/Editing:
Animation: The Global Population Over 300 Years, by Country
Since the 1800s, our global population has grown from 984 million people to almost 8 billion—an increase of more than 700%.
Which regions around the world have led this growth, and what’s expected for the rest of the century? This animated visualization by James Eagle shows 300 years of population growth, including historical figures as well as projections up to the year 2100.
Asia’s Current Dominance
For centuries, more than half of the world’s population has been concentrated in Asia. At certain points throughout history, the region has made up nearly 70% of the world’s population.
Here’s a look at 2021 figures, and how large each region’s population is relative to each other:
| Rank | Region | % of Global Population (2021) |
|---|---|---|
| 1 | Asia | 59.2% |
| 2 | Africa | 17.9% |
| 3 | Europe | 9.3% |
| 4 | North America | 7.5% |
| 5 | South America | 5.5% |
| 6 | Oceania | 0.6% |
China and India have been Asia’s largest population hubs, with China historically leading the front. In the 1950s China’s population was nearly double the size of India’s, but the gap has fluctuated over the years.
As China’s population growth continued, it was causing problems for the country as it struggled to scale up food production and infrastructure. By 1979, the Chinese government rolled out a one-child policy in an attempt to control the situation.
The program, which ended in 2016, had a number of unintended ramifications, but ultimately, it did succeed in slowing down the country’s population growth. And now, India is projected to overtake China as the world’s most populous country as early as 2023.
Africa’s Growing Piece of the Pie
Although Asia dominates the charts when it comes to overall population numbers currently, Africa’s growing population numbers are often overlooked.
While the continent’s total population is smaller than Asia’s, it will soon be home to the world’s largest working-age population, which could have a significant impact on the global economy in the years ahead.
This growth is being led by Nigeria, Africa’s most populous country. With megacities like Lagos (metro population: 21 million) and over 217 million inhabitants in total, Nigeria is projected to be the world’s third most populous country by the year 2050. Nigeria’s rapid growth is largely thanks to its high birth rate, which is nearly double the global average.

This article was published as a part of Visual Capitalist's Creator Program, which features data-driven visuals from some of our favorite Creators around the world.


Demographics
The Smallest Gender Wage Gaps in OECD Countries
Which OECD countries have the smallest gender wage gaps? We look at the 10 countries with gaps lower than the average.


The Smallest Gender Pay Gaps in OECD Countries
This was originally posted on our Voronoi app. Download the app for free on iOS or Android and discover incredible data-driven charts from a variety of trusted sources.
Among the 38 member countries in the Organization for Economic Cooperation and Development (OECD), several have made significant strides in addressing income inequality between men and women.
In this graphic we’ve ranked the OECD countries with the 10 smallest gender pay gaps, using the latest data from the OECD for 2022.
The gender pay gap is calculated as the difference between median full-time earnings for men and women divided by the median full-time earnings of men.
Which Countries Have the Smallest Gender Pay Gaps?
Luxembourg’s gender pay gap is the lowest among OECD members at only 0.4%—well below the OECD average of 11.6%.
| Rank | Country | Percentage Difference in Men's & Women's Full-time Earnings |
|---|---|---|
| 1 | 🇱🇺 Luxembourg | 0.4% |
| 2 | 🇧🇪 Belgium | 1.1% |
| 3 | 🇨🇷 Costa Rica | 1.4% |
| 4 | 🇨🇴 Colombia | 1.9% |
| 5 | 🇮🇪 Ireland | 2.0% |
| 6 | 🇭🇷 Croatia | 3.2% |
| 7 | 🇮🇹 Italy | 3.3% |
| 8 | 🇳🇴 Norway | 4.5% |
| 9 | 🇩🇰 Denmark | 5.8% |
| 10 | 🇵🇹 Portugal | 6.1% |
| OECD Average | 11.6% |
Notably, eight of the top 10 countries with the smallest gender pay gaps are located in Europe, as labor equality laws designed to target gender differences have begun to pay off.
The two other countries that made the list were Costa Rica (1.4%) and Colombia (1.9%), which came in third and fourth place, respectively.
How Did Luxembourg (Nearly) Eliminate its Gender Wage Gap?
Luxembourg’s virtually-non-existent gender wage gap in 2020 can be traced back to its diligent efforts to prioritize equal pay. Since 2016, firms that have not complied with the Labor Code’s equal pay laws have been subjected to penalizing fines ranging from €251 to €25,000.
Higher female education rates also contribute to the diminishing pay gap, with Luxembourg tied for first in the educational attainment rankings of the World Economic Forum’s Global Gender Gap Index Report for 2023.
See More Graphics about Demographics and Money
While these 10 countries are well below the OECD’s average gender pay gap of 11.6%, many OECD member countries including the U.S. are significantly above the average. To see the full list of the top 10 OECD countries with the largest gender pay gaps, check out this visualization.

-

 Real Estate2 weeks ago
Visualizing America’s Shortage of Affordable Homes
-

 Technology1 week ago
Ranked: Semiconductor Companies by Industry Revenue Share
-

 Money1 week ago
Which States Have the Highest Minimum Wage in America?
-

 Real Estate1 week ago
Ranked: The Most Valuable Housing Markets in America
-

 Business2 weeks ago
Charted: Big Four Market Share by S&P 500 Audits
-

 AI2 weeks ago
The Stock Performance of U.S. Chipmakers So Far in 2024
-

 Misc2 weeks ago
Almost Every EV Stock is Down After Q1 2024
-

 Money2 weeks ago
Where Does One U.S. Tax Dollar Go?