Markets
Ranked: The 100 Biggest Public Companies in the World
View the full-resolution version of this infographic.
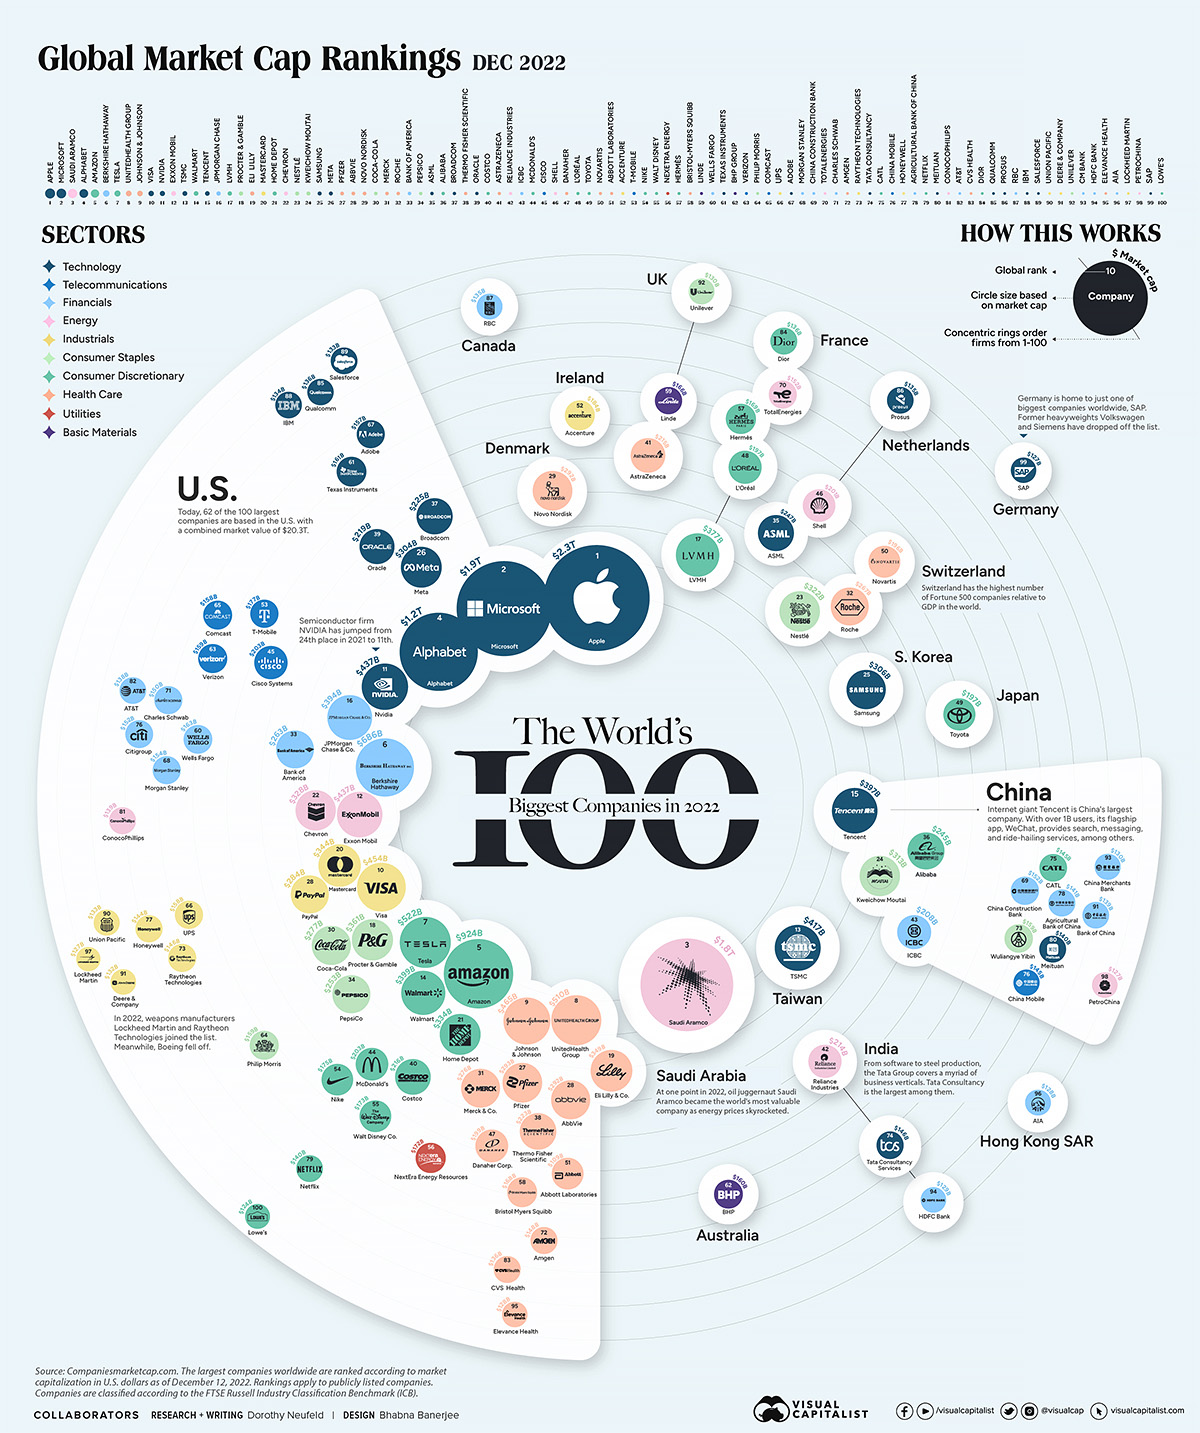


The Biggest Companies in the World in 2022
View the high-resolution of the infographic by clicking here.
This year has been shaped by uncomfortable macroeconomic headwinds.
Trillions of dollars were erased in public company market capitalizations, investor confidence waned, and cost pressures squeezed consumer pocketbooks.
Taken together, many of the world’s largest companies experienced sharp declines in market share. Still, a few companies in key sectors had positive growth over the year.
As 2022 comes to a close, the above infographic shows the biggest companies in the world, using data from Companiesmarketcap.com.
The World’s Largest Public Companies in 2022
Today, Apple stands as the world’s most valuable company, towering at a $2.3 trillion valuation.
Despite the tech downturn of 2022—driven by rising interest rates and slower sales—Apple maintained its top spot. This was largely thanks to record revenues and healthy consumer demand for iPhones, which drive about half of its total revenue.
Following Apple is Microsoft. Unlike Apple, Microsoft has faced slower earnings over the year due to lower demand for personal computers and the weighing impact of a strong U.S. dollar. Overall, about 50% of the company’s sales take place overseas.
As we show below, there are now only four companies left in the trillion dollar market cap club.
| 2022 Rank | Company | Market Capitalization | Sector | Location |
|---|---|---|---|---|
| 1 | Apple | $2.3T | Technology | 🇺🇸 U.S. |
| 2 | Microsoft | $1.9T | Technology | 🇺🇸 U.S. |
| 3 | Saudi Aramco | $1.8T | Energy | 🇸🇦 Saudi Arabia |
| 4 | Alphabet | $1.2T | Technology | 🇺🇸 U.S. |
| 5 | Amazon | $924B | Consumer Discretionary | 🇺🇸 U.S. |
| 6 | Berkshire Hathaway | $686B | Financials | 🇺🇸 U.S. |
| 7 | Tesla | $522B | Consumer Discretionary | 🇺🇸 U.S. |
| 8 | UnitedHealth Group | $510B | Health Care | 🇺🇸 U.S. |
| 9 | Johnson & Johnson | $465B | Health Care | 🇺🇸 U.S. |
| 10 | Visa | $454B | Industrials | 🇺🇸 U.S. |
| 11 | NVIDIA | $437B | Technology | 🇺🇸 U.S. |
| 12 | Exxon Mobil | $437B | Energy | 🇺🇸 U.S. |
| 13 | TSMC | $417B | Technology | 🇹🇼 Taiwan |
| 14 | Walmart | $399B | Consumer Discretionary | 🇺🇸 U.S. |
| 15 | Tencent | $397B | Technology | 🇨🇳 China |
| 16 | JPMorgan Chase | $394B | Financials | 🇺🇸 U.S. |
| 17 | LVMH | $377B | Consumer Discretionary | 🇫🇷 France |
| 18 | Procter & Gamble | $361B | Consumer Staples | 🇺🇸 U.S. |
| 19 | Eli Lilly | $349B | Health Care | 🇺🇸 U.S. |
| 20 | Mastercard | $344B | Industrials | 🇺🇸 U.S. |
| 21 | Home Depot | $334B | Consumer Discretionary | 🇺🇸 U.S. |
| 22 | Chevron | $328B | Energy | 🇺🇸 U.S. |
| 23 | Nestlé | $322B | Consumer Staples | 🇨🇭 Switzerland |
| 24 | Kweichow Moutai | $313B | Consumer Staples | 🇨🇳 China |
| 25 | Samsung | $306B | Technology | 🇰🇷 South Korea |
| 26 | Meta (Facebook) | $304B | Technology | 🇺🇸 U.S. |
| 27 | Pfizer | $293B | Health Care | 🇺🇸 U.S. |
| 28 | AbbVie | $292B | Health Care | 🇺🇸 U.S. |
| 29 | Novo Nordisk | $292B | Health Care | 🇩🇰 Denmark |
| 30 | Coca-Cola | $277B | Consumer Staples | 🇺🇸 U.S. |
| 31 | Merck | $276B | Health Care | 🇺🇸 U.S. |
| 32 | Roche | $267B | Health Care | 🇨🇭 Switzerland |
| 33 | Bank of America | $263B | Financials | 🇺🇸 U.S. |
| 34 | Pepsico | $253B | Consumer Staples | 🇺🇸 U.S. |
| 35 | ASML | $247B | Technology | 🇳🇱 Netherlands |
| 36 | Alibaba | $245B | Consumer Discretionary | 🇨🇳 China |
| 37 | Broadcom | $225B | Technology | 🇺🇸 U.S. |
| 38 | Thermo Fisher Scientific | $223B | Health Care | 🇺🇸 U.S. |
| 39 | Oracle | $219B | Technology | 🇺🇸 U.S. |
| 40 | Costco | $216B | Consumer Discretionary | 🇺🇸 U.S. |
| 41 | Astrazeneca | $215B | Health Care | 🇬🇧 United Kingdom |
| 42 | Reliance Industries | $214B | Energy | 🇮🇳 India |
| 43 | ICBC | $208B | Financials | 🇨🇳 China |
| 44 | McDonald's | $203B | Consumer Discretionary | 🇺🇸 U.S. |
| 45 | Cisco | $203B | Telecommunications | 🇺🇸 U.S. |
| 46 | Shell | $201B | Energy | 🇳🇱 Netherlands |
| 47 | Danaher | $199B | Health Care | 🇺🇸 U.S. |
| 48 | L'Oréal | $197B | Consumer Discretionary | 🇫🇷 France |
| 49 | Toyota | $197B | Consumer Discretionary | 🇯🇵 Japan |
| 50 | Novartis | $196B | Health Care | 🇨🇭 Switzerland |
| 51 | Abbott Laboratories | $109B | Health Care | 🇺🇸 U.S. |
| 52 | Accenture | $184B | Industrials | 🇮🇪 Ireland |
| 53 | T-Mobile | $177B | Telecommunications | 🇺🇸 U.S. |
| 54 | Nike | $175B | Consumer Discretionary | 🇺🇸 U.S. |
| 55 | Walt Disney | $173B | Consumer Discretionary | 🇺🇸 U.S. |
| 56 | Nextera Energy | $172B | Utilities | 🇺🇸 U.S. |
| 57 | Hermès | $169B | Consumer Discretionary | 🇫🇷 France |
| 58 | Bristol-Myers Squibb | $168B | Health Care | 🇺🇸 U.S. |
| 59 | Linde | $166B | Basic Materials | 🇬🇧 United Kingdom |
| 60 | Wells Fargo | $163B | Financials | 🇺🇸 U.S. |
| 61 | Texas Instruments | $161B | Technology | 🇺🇸 U.S. |
| 62 | BHP Group | $160B | Basic Materials | 🇦🇺 Australia |
| 63 | Verizon | $159B | Telecommunications | 🇺🇸 U.S. |
| 64 | Philip Morris | $159B | Consumer Staples | 🇺🇸 U.S. |
| 65 | Comcast | $158B | Telecommunications | 🇺🇸 U.S. |
| 66 | UPS | $158B | Industrials | 🇺🇸 U.S. |
| 67 | Adobe | $157B | Technology | 🇺🇸 U.S. |
| 68 | Morgan Stanley | $154B | Financials | 🇺🇸 U.S. |
| 69 | China Construction Bank | $152B | Financials | 🇨🇳 China |
| 70 | TotalEnergies | $152B | Energy | 🇫🇷 France |
| 71 | Charles Schwab | $150B | Financials | 🇺🇸 U.S. |
| 72 | Amgen | $148B | Health Care | 🇺🇸 U.S. |
| 73 | Raytheon Technologies | $146B | Industrials | 🇺🇸 U.S. |
| 74 | Tata Consultancy | $146B | Technology | 🇮🇳 India |
| 75 | CATL | $145B | Consumer Discretionary | 🇨🇳 China |
| 76 | China Mobile | $145B | Telecommunications | 🇨🇳 China |
| 77 | Honeywell | $144B | Industrials | 🇺🇸 U.S. |
| 78 | Agricultural Bank of China | $141B | Financials | 🇨🇳 China |
| 79 | Netflix | $140B | Consumer Discretionary | 🇺🇸 U.S. |
| 80 | Meituan | $140B | Technology | 🇨🇳 China |
| 81 | ConocoPhillips | $139B | Energy | 🇺🇸 U.S. |
| 82 | AT&T | $138B | Financials | 🇺🇸 U.S. |
| 83 | CVS Health | $136B | Health Care | 🇺🇸 U.S. |
| 84 | Dior | $136B | Consumer Discretionary | 🇫🇷 France |
| 85 | Qualcomm | $136B | Technology | 🇺🇸 U.S. |
| 86 | Prosus | $135B | Technology | 🇳🇱 Netherlands |
| 87 | RBC | $135B | Financials | 🇨🇦 Canada |
| 88 | IBM | $134B | Technology | 🇺🇸 U.S. |
| 89 | Salesforce | $133B | Technology | 🇺🇸 U.S. |
| 90 | Union Pacific | $133B | Industrials | 🇺🇸 U.S. |
| 91 | Deere & Company | $132B | Industrials | 🇺🇸 U.S. |
| 92 | Unilever | $130B | Consumer Staples | 🇬🇧 United Kingdom |
| 93 | CM Bank | $130B | Financials | 🇨🇳 China |
| 94 | HDFC Bank | $129B | Financials | 🇮🇳 India |
| 95 | Elevance Health | $128B | Health Care | 🇺🇸 U.S. |
| 96 | AIA | $128B | Financials | 🇭🇰 Hong Kong |
| 97 | Lockheed Martin | $127B | Industrials | 🇺🇸 U.S. |
| 98 | PetroChina | $127B | Energy | 🇨🇳 China |
| 99 | SAP | $127B | Technology | 🇩🇪 Germany |
| 100 | Lowe's | $124B | Consumer Discretionary | 🇺🇸 U.S. |
*As of Dec 12, 2022.
Oil giant Saudi Aramco is the third largest publicly-traded company globally, at $1.8 trillion. It’s also the only non-U.S. company in the top 10.
In May, the state-run company briefly became the most valuable company on the planet as soaring energy prices boosted earnings. Saudia Arabia is the largest exporter of oil in the world, and the country’s economy is forecast to grow 7.6% in 2022—one of the fastest globally.
Overall, 62 companies of the 100 largest are headquartered in the U.S., 11 are based in China, and five are located in France.
Top 10 Performance in 2022
For many of the world’s largest companies, 2022 was a brutal year for performance.
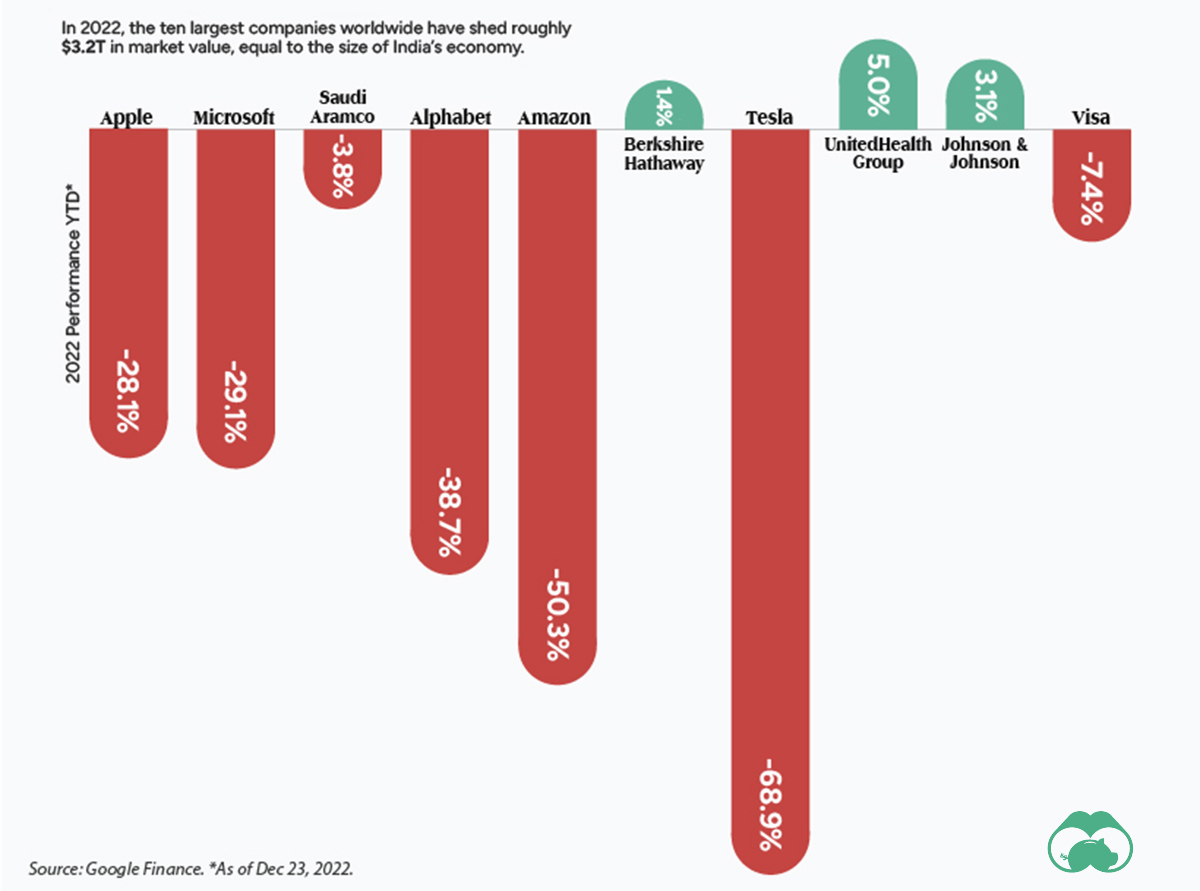
As the above graphic shows, the vast majority of the world’s titans saw their market values decline. Half of these companies saw double-digit drops.
Tesla has witnessed nearly 70% of its market cap being erased this year. Two main factors are behind this drop: falling demand, especially in China, and CEO Elon Musk’s volatile and risky acquisition of Twitter.
On the other hand, UnitedHealth Group has seen the strongest performance among the top 10.
The company, which rakes in a large share of its earnings from employer-backed insurance plans, said that recessionary impacts had not yet begun materializing in 2022.
Biggest Companies in the World, by Sector
Even with sinking market values across the sector in 2022, tech remains dominant.
Among the world’s biggest companies, 20 are in tech, spanning a combined market value of $9.2 trillion. For perspective, that’s about 31% of the market value of the 100 largest companies.
| Rank | Sector | Combined Market Value | Number of Companies | Biggest Company in Sector |
|---|---|---|---|---|
| 1 | 👩💻 Technology | $9.2T | 20 | Apple |
| 2 | 🚗 Consumer Discretionary | $4.7T | 17 | Amazon |
| 3 | 🩺 Health Care | $4.3T | 17 | UnitedHealth Group |
| 4 | 🛢️ Energy | $3.4T | 8 | Saudi Aramco |
| 5 | 💵 Financials | $3.0T | 14 | Berkshire Hathaway |
| 6 | 🏭 Industrials | $1.8T | 9 | Visa |
| 7 | 🥫 Consumer Staples | $1.8T | 7 | Procter & Gamble |
| 8 | 📞 Telecommunications | $841B | 5 | Cisco |
| 9 | ⛏️ Basic Materials | $326B | 2 | Linde |
| 10 | 🔌 Utilities | $127B | 1 | Nextera Energy |
Companies are classified according to the FTSE Russell Industry Classification Benchmark. *As of Dec 12, 2022.
Consumer discretionary and health care sectors fall next in line, with big players such as Amazon and Johnson & Johnson among their ranks.
At the other end of the spectrum is utilities, the smallest sector overall at least pertaining to the largest companies list. NextEra Energy, the sole utilities company among the rankings is one of the world’s largest developers of wind and solar energy. Over the next three years, it plans to invest up to $95 billion in greening its power operations.
Change of Fortune
It comes as no surprise that many of the biggest companies in the world are long-established players in global markets.
Yet within the rankings, some of the notable risers compared to 2021 are UnitedHealth Group, which launched from #19 in 2021 to #8 this year and NVIDIA which has climbed to become the 11th largest company globally, up from #24 last year.
By contrast, some of the biggest losers are Meta (Facebook’s parent company) and Alibaba. Meta has fallen across the rankings to #26 in 2022 from #6 in 2021. Meanwhile, Alibaba was once the ninth largest globally but has tumbled to #36. Both companies have seen considerable value wiped from their market caps—roughly 66% and 28%, respectively—amid lagging earnings.
With the year coming to a close, it remains to be seen whether the world’s biggest companies stage a comeback in 2023, or face more challenging conditions ahead.


Markets
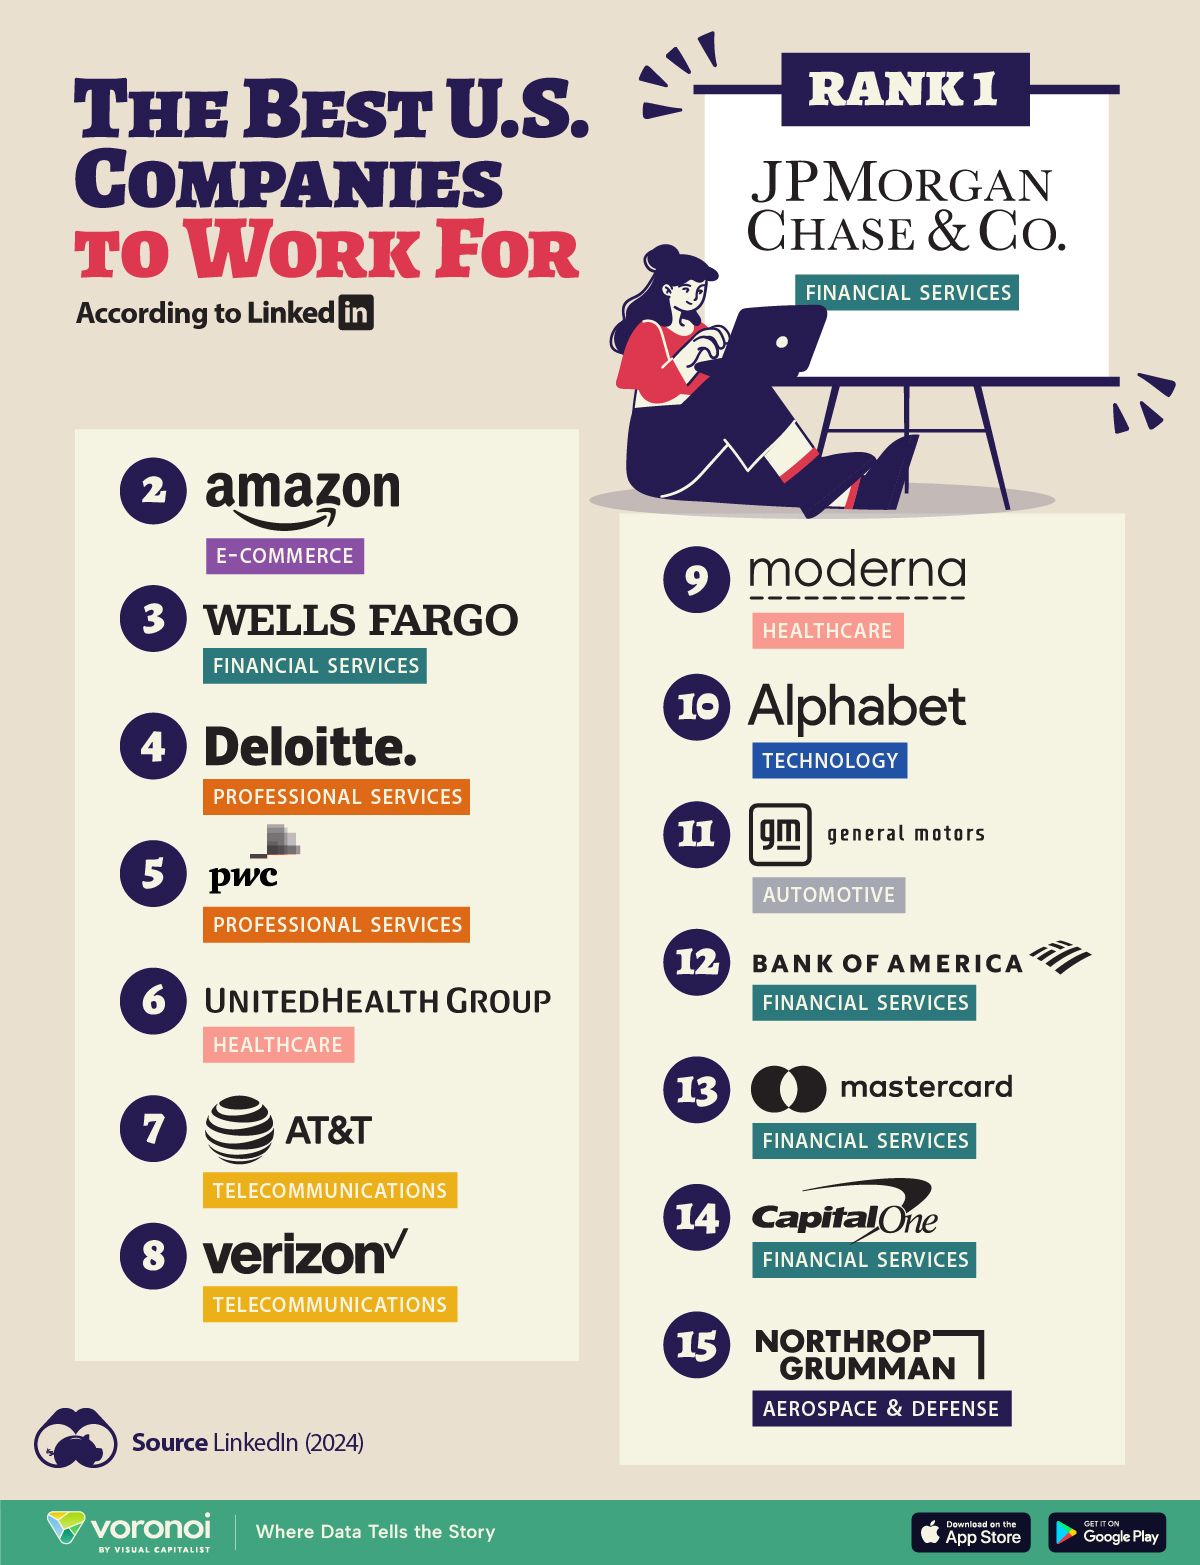
The Best U.S. Companies to Work for According to LinkedIn
We visualized the results of a LinkedIn study on the best U.S. companies to work for in 2024.
The Best U.S. Companies to Work for According to LinkedIn
This was originally posted on our Voronoi app. Download the app for free on iOS or Android and discover incredible data-driven charts from a variety of trusted sources.
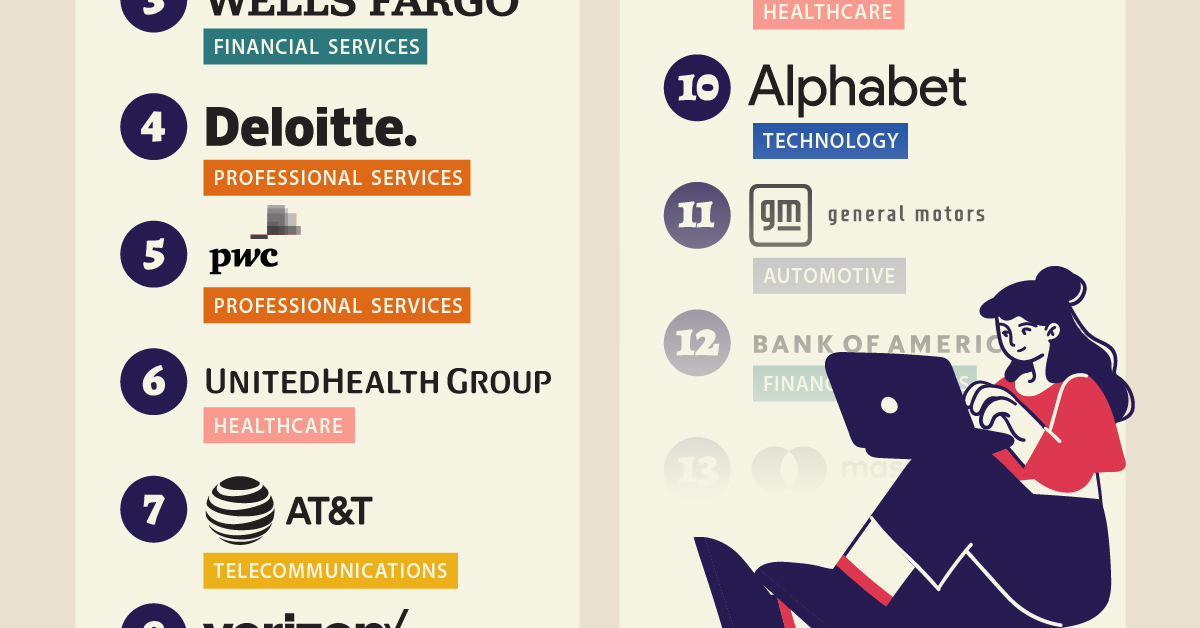
In this graphic, we list the 15 best U.S. companies to work for in 2024, according to LinkedIn data.
LinkedIn ranked companies based on eight pillars: ability to advance, skills growth, company stability, external opportunity, company affinity, gender diversity, educational background, and employee presence in the country.
To be eligible, companies must have had 5,000 or more global employees, with at least 500 in the country as of December 31, 2023.
Data and Highlights
Financial institutions dominate the ranking of the best U.S. companies to work for in 2024, with JP Morgan Chase & Co. ranking first.
| Rank | Company | Industry |
|---|---|---|
| 1 | JP Morgan Chase & Co. | Financial Services |
| 2 | Amazon | E-commerce |
| 3 | Wells Fargo | Financial Services |
| 4 | Deloitte | Professional Services |
| 5 | PwC | Professional Services |
| 6 | UnitedHealth Group | Healthcare |
| 7 | AT&T | Telecommunications |
| 8 | Verizon | Telecommunications |
| 9 | Moderna | Pharmaceuticals |
| 10 | Alphabet Inc. | Technology |
| 11 | General Motors | Automotive |
| 12 | Bank of America | Financial Services |
| 13 | Mastercard | Financial Services |
| 14 | Capital One | Financial Services |
| 15 | Northrop Grumman | Aerospace & Defense |
J.P. Morgan has a program that offers opportunities for candidates without a university degree. In fact, in 2022, 75% of job descriptions at the bank for experienced hires did not require a college degree.
Meanwhile, Deloitte and Amazon offer a variety of free training courses, including in AI.
Moderna includes in its employee package benefits to help avoid employee burnout — from subsidized commuter expenses and pop-up daycare centers, to wellness coaches.
Mastercard offers flexible work availability, with 11.5% remote and 89% hybrid options.
It’s also interesting to note that only Amazon and Alphabet made the cut from the ‘Magnificent Seven’ companies (Apple, Microsoft, Google parent Alphabet, Amazon, Nvidia, Meta Platforms, and Tesla).
See more about the best companies to work for in this infographic, which covers a separate ranking from Glassdoor.

-

 Demographics7 days ago
The Countries That Have Become Sadder Since 2010
-

 Green2 weeks ago
Ranked: The Countries With the Most Air Pollution in 2023
-

 Green2 weeks ago
Ranking the Top 15 Countries by Carbon Tax Revenue
-

 Markets2 weeks ago
U.S. Debt Interest Payments Reach $1 Trillion
-

 Mining2 weeks ago
Gold vs. S&P 500: Which Has Grown More Over Five Years?
-

 Energy2 weeks ago
The World’s Biggest Nuclear Energy Producers
-

 Misc2 weeks ago
How Hard Is It to Get Into an Ivy League School?
-

 Debt2 weeks ago
How Debt-to-GDP Ratios Have Changed Since 2000