Brands
The Best-Selling Car in America, Every Year Since 1978
The Best-Selling Car in America, Every Year Since 1978
Cars have been a staple of the U.S. economy almost since their inception. But as vehicle designs have evolved over time, and consumer tastes alongside them, the best-selling car in America has changed as well.
Finding the right mix of affordability, style, and features has meant that different manufacturers have been in the market lead during different decades.
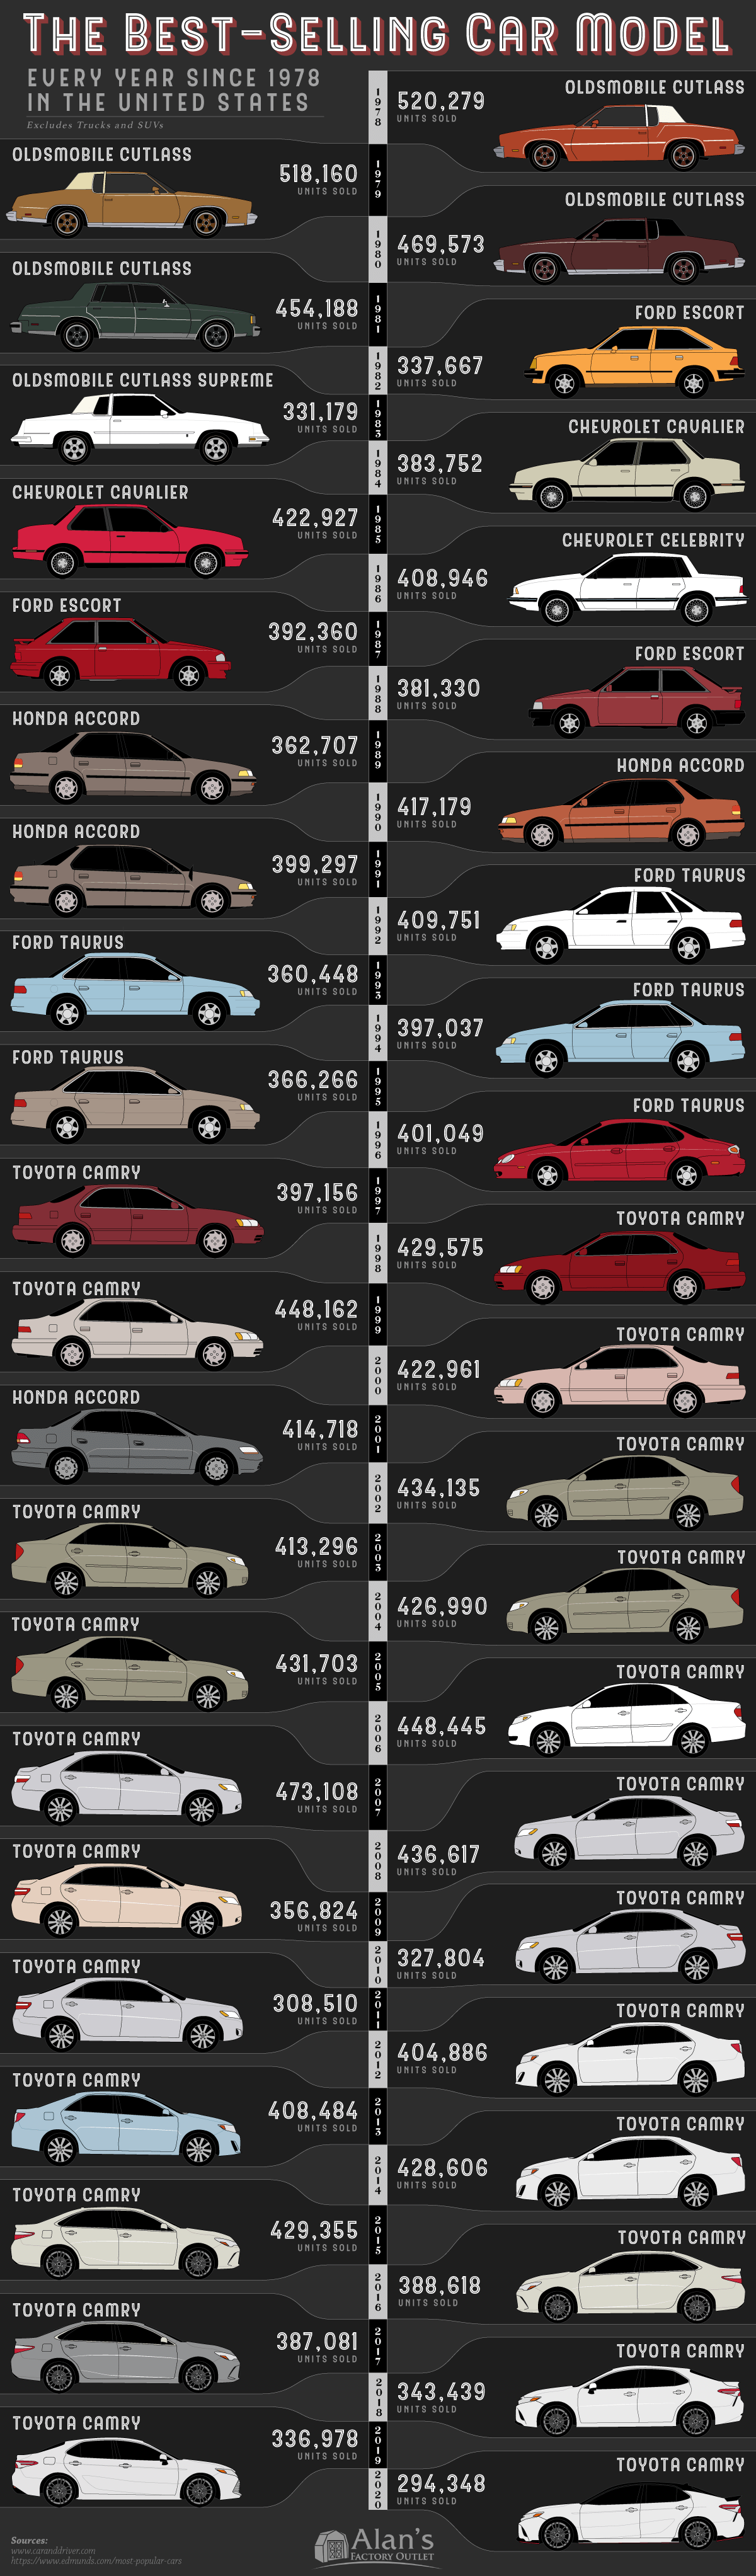
This infographic from Alan’s Factory Outlet shows the most-purchased cars in the U.S. since 1978, not including trucks and SUVs.
What Is The Best-Selling Car in America By Year?
From 1978 to 2020, over 348 million cars were sold in the U.S., or an average of 8.1 million cars per year. Car sales were especially strong during times of high oil prices, such as following the 1979 oil crisis, as consumers avoided less fuel-efficient trucks and SUVs.
And throughout most of the 20th century, car sales in the U.S. were led by American manufacturers.
From 1978 to 1988, two of the “Big Three” Detroit-based auto manufacturers had the best-selling cars in the country. GM had two models of the Oldsmobile Cutlass and two different Chevrolets in the top spot, while Ford was able to compete with the compact Ford Escort.
But since the late 1980s, Japanese manufacturers started to take over in affordability, reliability, and overall sales.
| Years | Car Model | Best-Selling Span (U.S.) |
|---|---|---|
| 1978–1981 | Oldsmobile Cutlass | 4 years |
| 1982 | Ford Escort | 1 year |
| 1983 | Oldsmobile Cutlass Supreme | 1 year |
| 1984–1985 | Chevrolet Cavalier | 2 years |
| 1986 | Chevrolet Celebrity | 1 year |
| 1987–1988 | Ford Escort | 2 years |
| 1989–1991 | Honda Accord | 3 years |
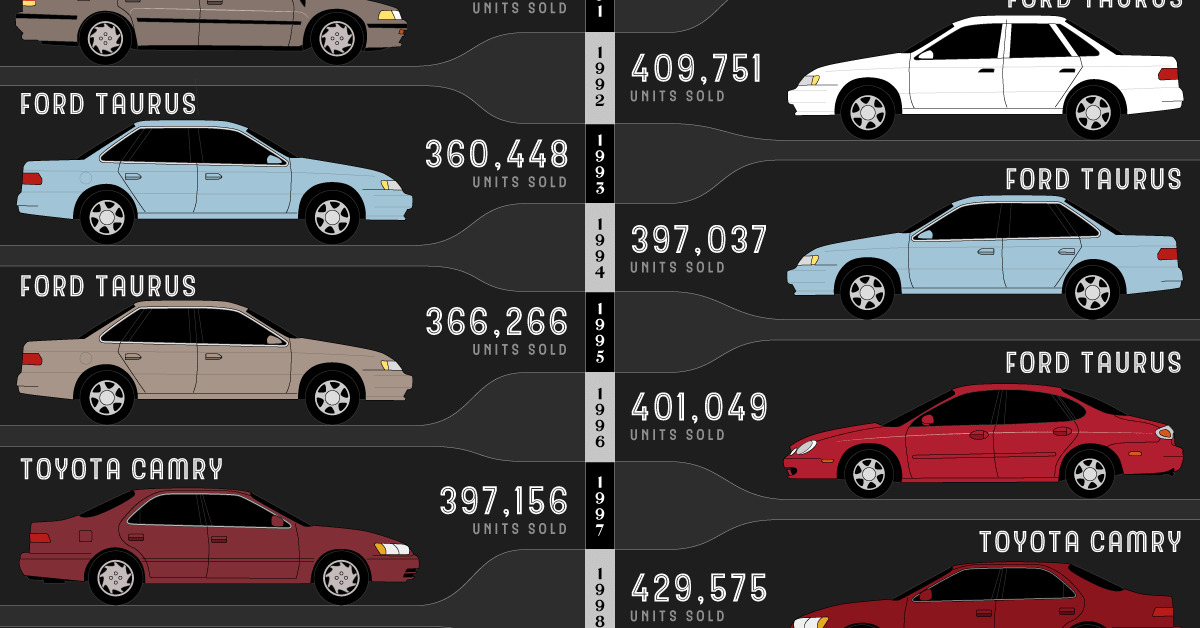
| 1992–1996 | Ford Taurus | 5 years |
| 1997–2000 | Toyota Camry | 4 years |
| 2001 | Honda Accord | 1 year |
| 2002–2020 | Toyota Camry | 19 years |
After Honda and Ford fought closely for the most popular cars with the Accord and the Taurus, Toyota grabbed the crown with the ultra-popular Toyota Camry.
Toyota, which was the world’s largest automaker by market cap for a majority of the last 30 years, also has the world’s best-selling car of all-time with another popular model, the Toyota Corolla.
The company’s cars have resonated with consumers due to reliability, safety, and efficiency in spite of being mass-produced and affordable. High ownership satisfaction and low incidence rates also led Camrys to have high resale value.
Runner Ups and Best-Selling Trucks and SUVs
Just behind Toyota for many years was another Japanese automaker, Honda. The company’s Accord and Civic models consistently ranked just behind the Toyota Camry in U.S. sales throughout most of the 2000s.
Despite most of the world preferring cars for vehicle purchases, the U.S. has become light truck and SUV dominant since the 2000s.
| Car Model | Units Sold (U.S. 2020) |
|---|---|
| Ford F-Series | 787,422 |
| Chevrolet Silverado | 594,094 |
| Ram pickup | 563,676 |
| Toyota RAV4 | 430,387 |
| Honda CR-V | 333,502 |
| Toyota Camry | 294,348 |
| Chevrolet Equinox | 270,994 |
| Honda Civic | 270,994 |
| GMC Sierra | 253,016 |
| Toyota Tacoma | 238,806 |
The proliferation of light trucks also meant that Toyota, one of the world’s leading hybrid sellers, saw the crossover/SUV Toyota RAV4 Hybrid beat the well-known Prius consistently in U.S. sales.
Meanwhile, electric car sales in the U.S. are still far behind, climbing up to 1.8% of sales in 2020 from 1.4% the year before. Compared to countries like Norway where electric cars make up the majority of vehicle sales, the U.S. will likely be dominated by light-trucks for years to come.


Misc
The Evolution of U.S. Beer Logos
In this graphic, we analyze the evolution of popular U.S. beer logos like Budweiser, Coors Light, Bud Light, and more.
The Evolution of U.S. Beer Logos
This was originally posted on our Voronoi app. Download the app for free on iOS or Android and discover incredible data-driven charts from a variety of trusted sources.
Despite selling a popular product, beer companies have to be creative to stand out in a competitive market.
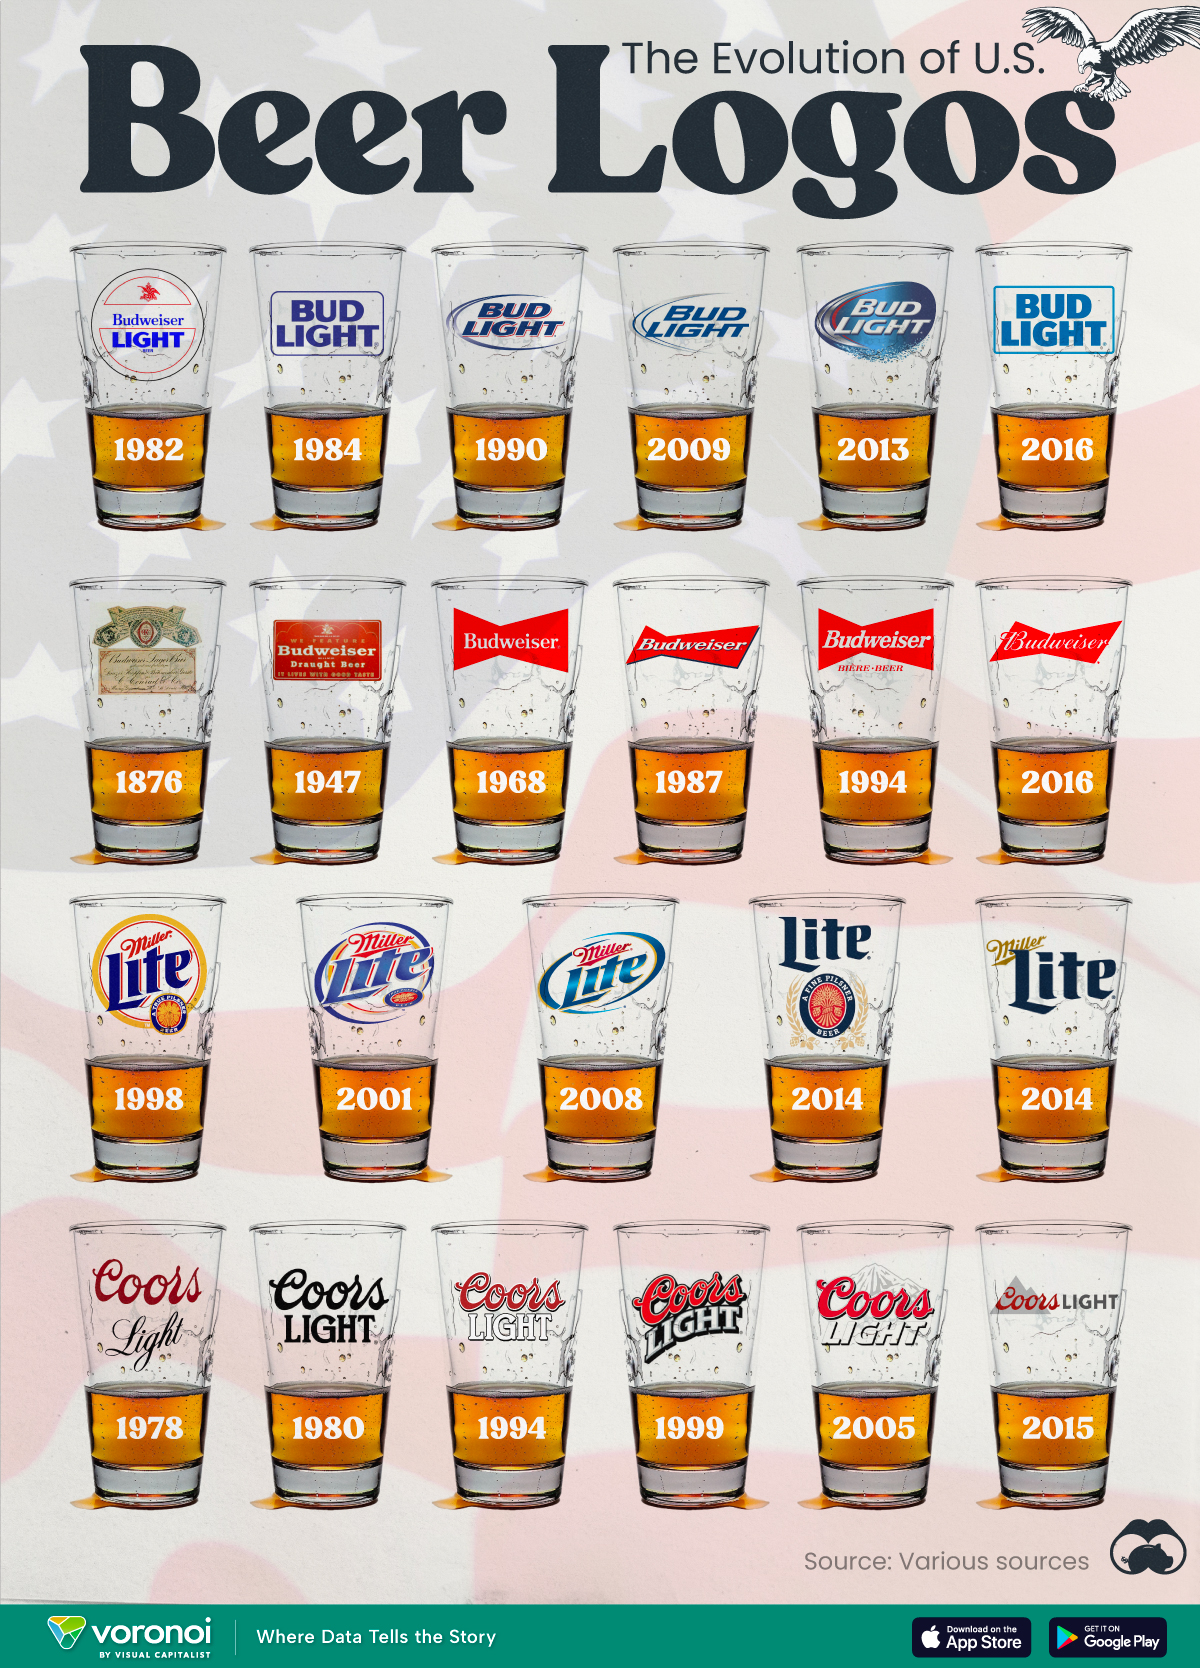
In this graphic, we analyze the evolution of some U.S. beer logos based on various sources. We chose brands based on a mixture of criteria, including popularity (based on YouGov surveys), availability of logo assets, and those with interesting developments.
Bud Light Back to the ’80s
Despite recent backlash and calls for a boycott after sending a commemorative can to transgender influencer Dylan Mulvaney, Bud Light remains one of America’s best-selling beers.
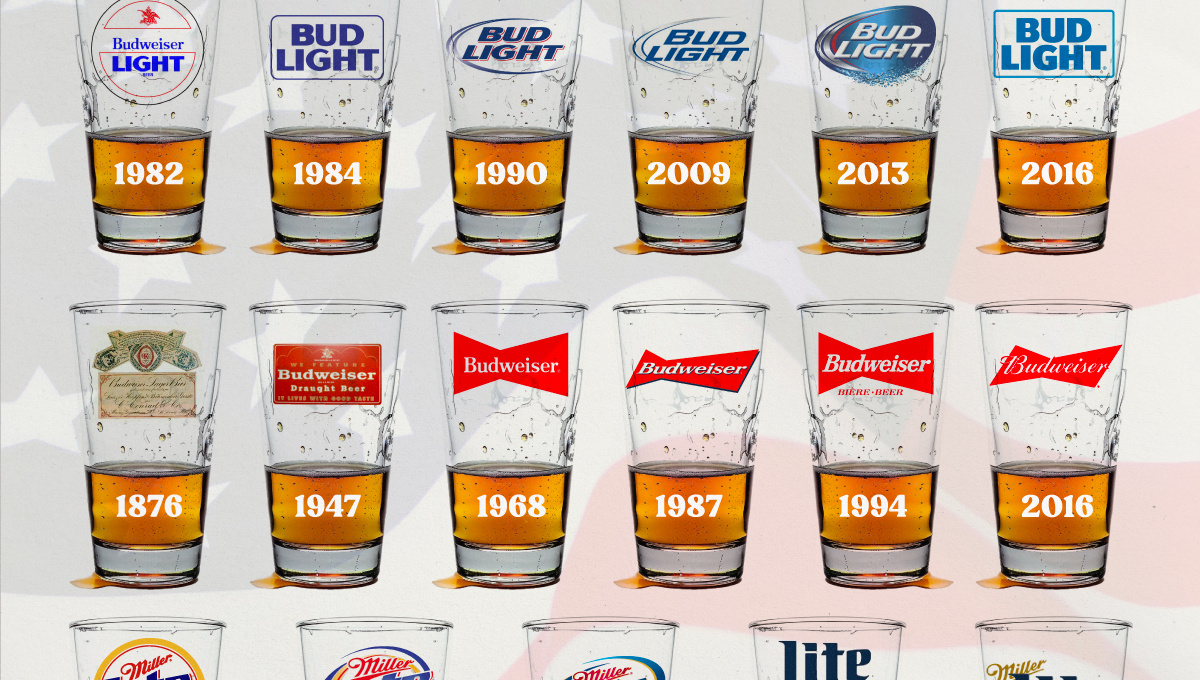
The brand of light beer, owned by the Anheuser-Busch company, has switched from its more circular logo with italic letters adopted in the 1990s back to the Bud Light badge of the 1980s. It is composed of heavy uppercase lettering, written in two levels in a shade of blue with the inscription placed on a solid white background and enclosed in a thin rectangular frame.
Miller Lite Goes Old School
After following a similar approach to Bud Light’s branding throughout the 2000s, Miller Lite decided to undergo a major rebranding in 2014.
The company returned to its 1970s roots, once again combining a white can with its original blue, gold, and red logo. The redesign was largely considered a success, given that Miller Lite sales immediately increased following the change.
A Symbol of American Brewing
The oldest brand on our U.S. beer list, the Budweiser logo, has undergone more than 15 changes over the years.
The design of two connected triangles represents a red bow tie, as a symbol of American brewing.
The colors of the Budweiser logo include a vibrant red, which helps the logo stand out and be easily recognizable from a distance. Studies also suggest that the color red stimulates appetite. Meanwhile, the white inscription symbolizes purity and cleanliness.
Curious to learn more about the beer market? Check out this graphic about global beer consumption.

-

 Markets6 days ago
The Most Valuable Companies in Major EU Economies
-

 Wealth2 weeks ago
Charted: Which City Has the Most Billionaires in 2024?
-

 Technology2 weeks ago
All of the Grants Given by the U.S. CHIPS Act
-

 Green2 weeks ago
The Carbon Footprint of Major Travel Methods
-

 United States1 week ago
Visualizing the Most Common Pets in the U.S.
-

 Culture1 week ago
The World’s Top Media Franchises by All-Time Revenue
-

 voronoi1 week ago
Best Visualizations of April on the Voronoi App
-

 Wealth1 week ago
Charted: Which Country Has the Most Billionaires in 2024?