Markets
The U.S. Stock Market: Best and Worst Performing Sectors in 2022
The U.S. Stock Market: Best and Worst Performing Sectors in 2022
The markets in 2022 were characterized by a lot more pain than gain.
In the U.S., the Fed hiked interest rates seven times. Globally, central banks raised interest rates for the first time in years in order to combat surging inflation. The Russian invasion of Ukraine and China’s COVID Zero ambitions threw markets and supply chains into further disarray.
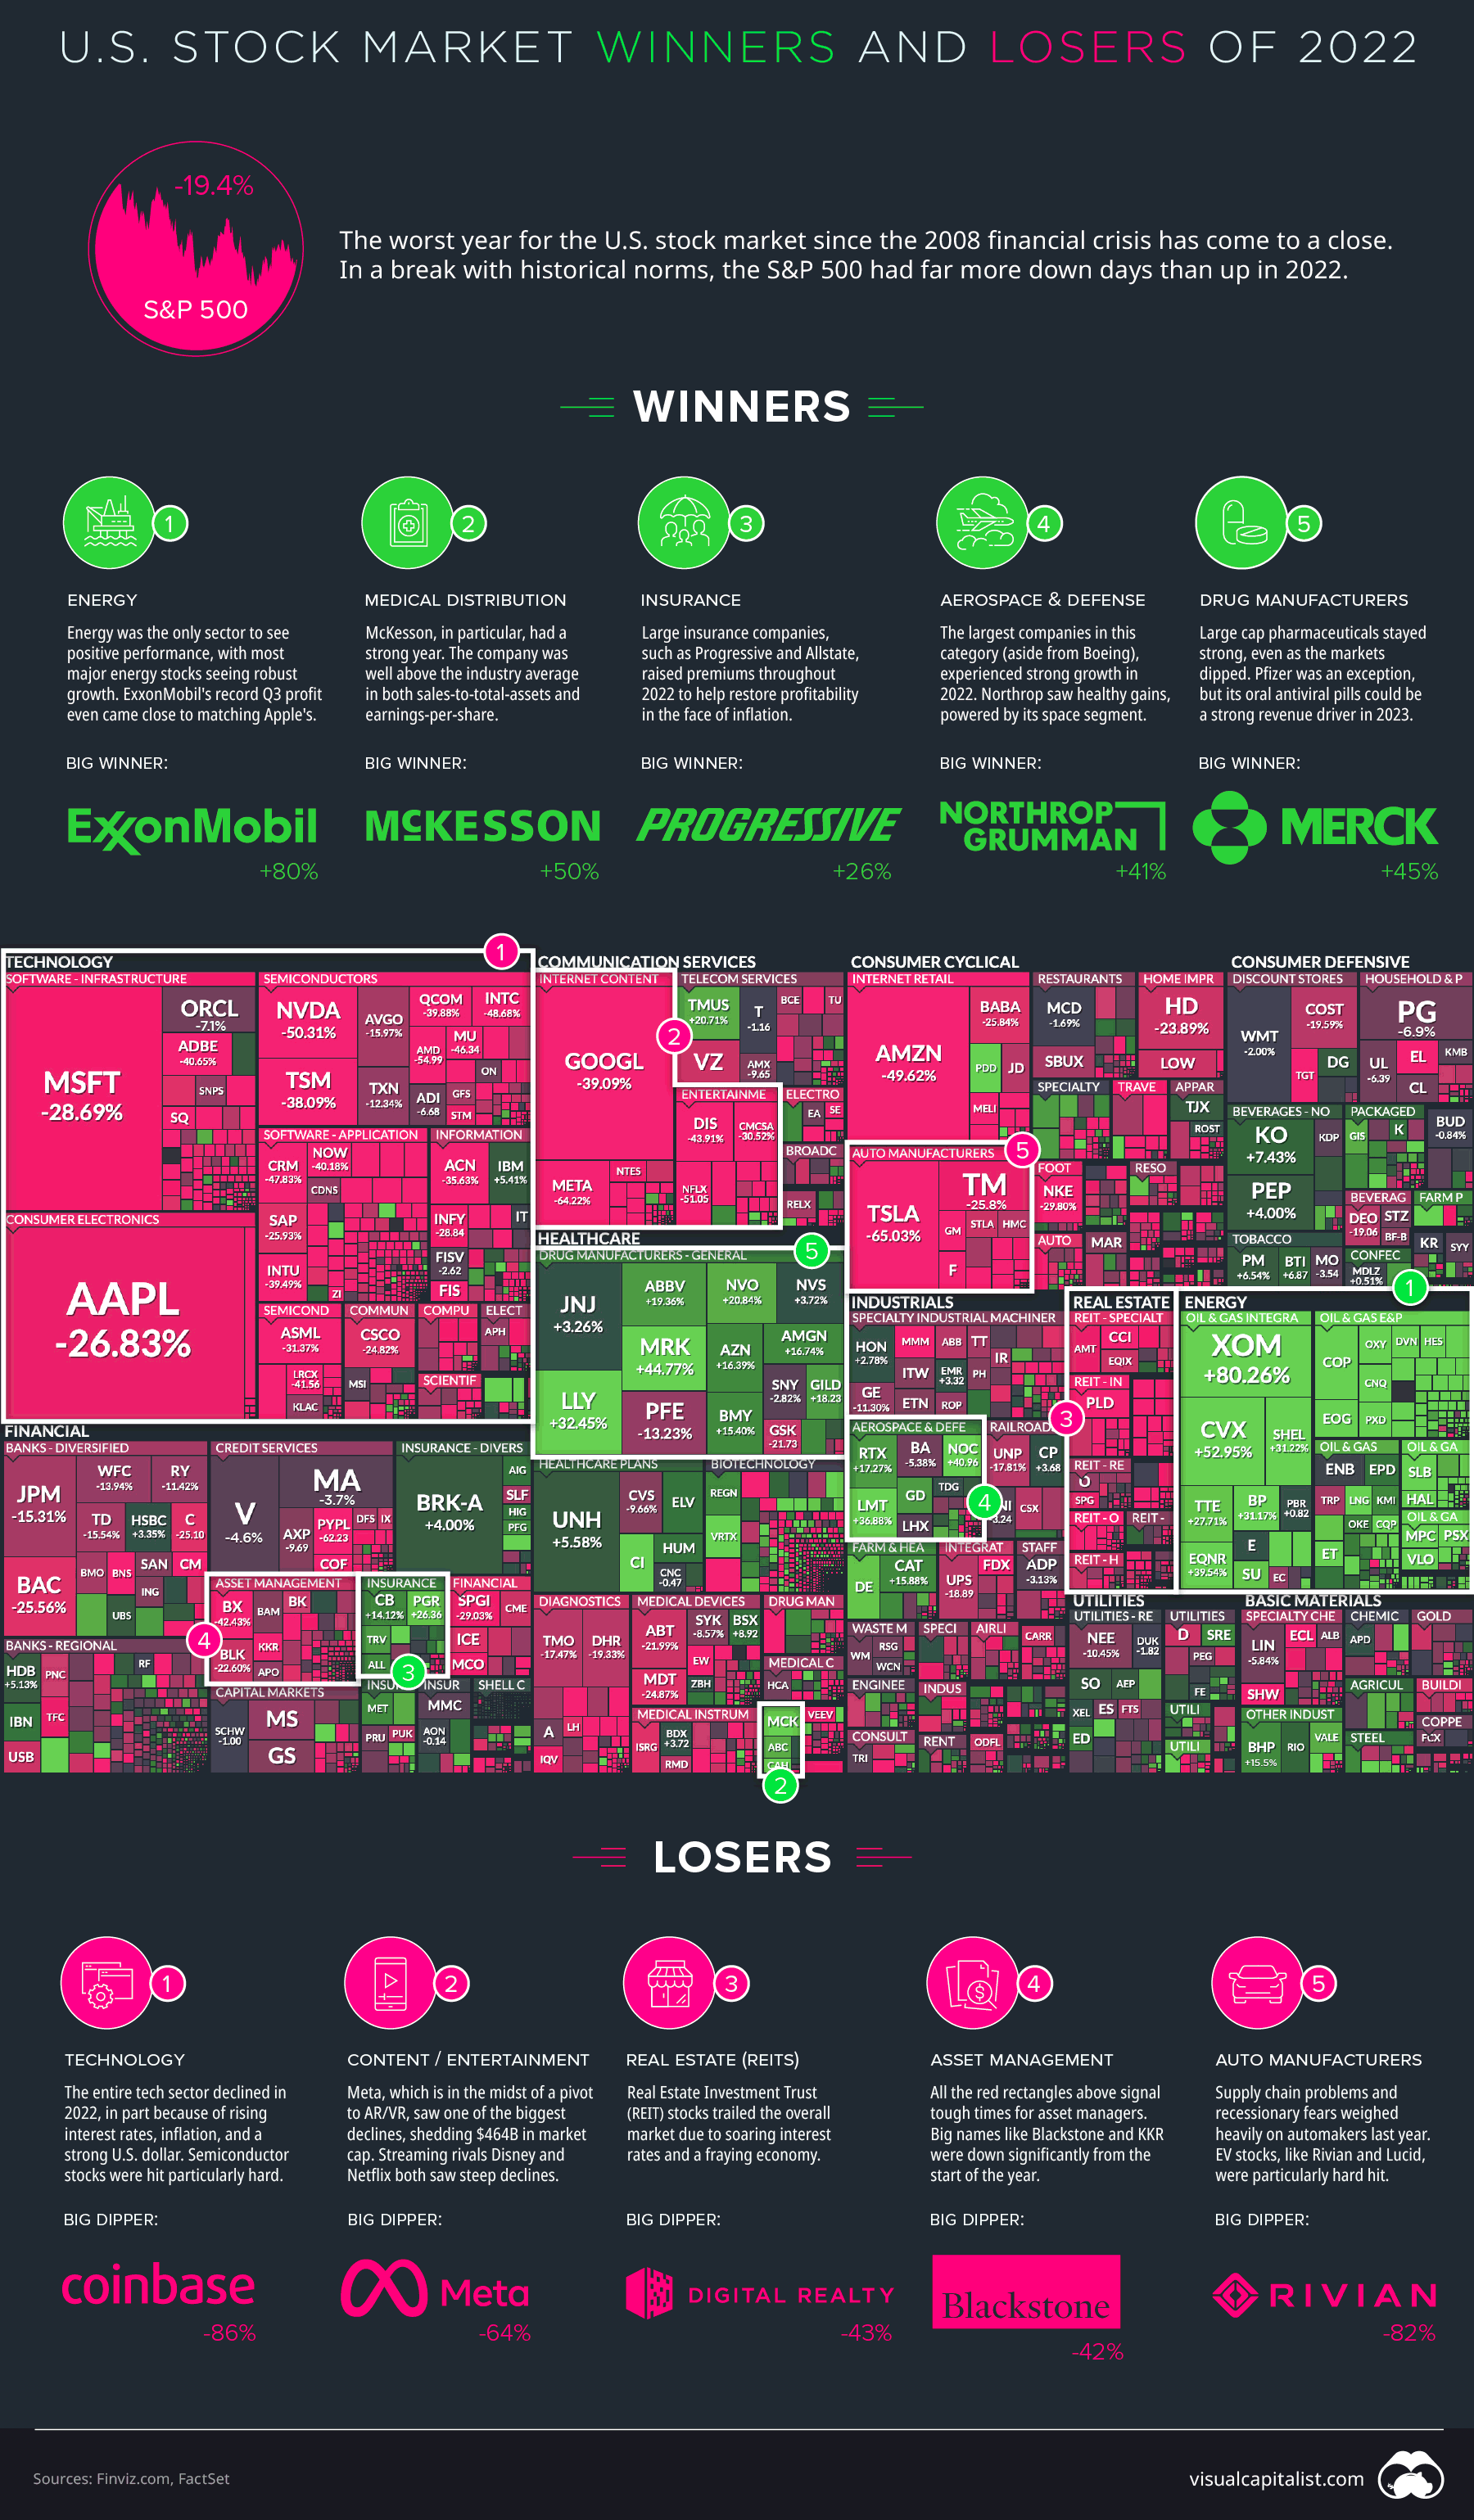
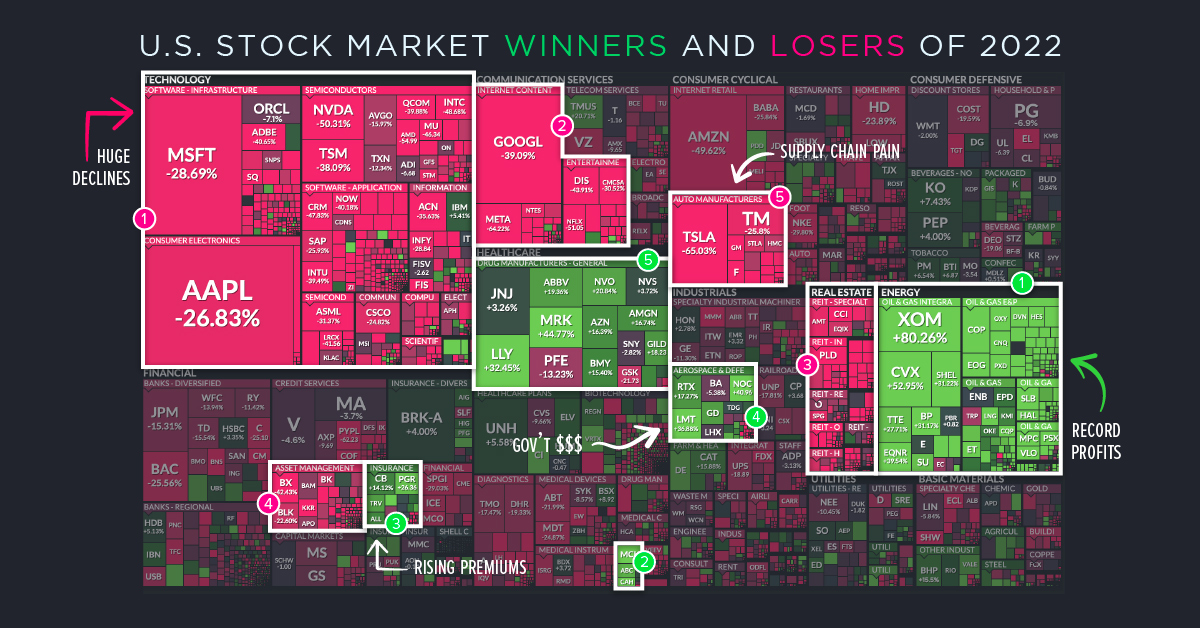
To recap the past 12 months, we’ve created an augmented version of the classic FinViz treemap, showing the final numbers posted for major U.S.-listed companies, sorted by sector and industry.
Below, we look closer at the majority of companies that finished the year in the red, and the few industries and companies that beat the odds and saw positive growth.
The Winners
In this year’s stock market visualization, there’s a lot more red than green. That said, there were winners to be found, even during this turbulent year. Here are a few of them:
Energy
Looking at the visualization above, it’s easy to see which sector dominated this year. In fact, energy was the only sector to see positive performance, with most major energy stocks seeing double-digit growth.
In particular, ExxonMobil had a monster year. The energy giant’s record Q3 profit came close to matching Apple’s (no small feat), and the company reportedly gave out hefty salary bumps and stock options to staff. This success didn’t go unnoticed as Exxon, and industry peers like Chevron, were excoriated for setting profit records while consumers felt the squeeze at the gas pump.
Healthcare (Sort of)
The healthcare sector was a mixed bag this year, but some winners did emerge.
Large cap pharmaceutical companies managed to stay strong, even as the markets languished. Merck led the way with +45% growth this year, with Novo Nordisk, AstraZeneca, AbbVie, and Eli Lilly (+32%) also posting double-digit growth. For the latter two companies, this is a continuation of a long-term trend. Over the past decade, AbbVie is up over 600%, and Eli Lilly is up more than 800%.
Pfizer (-12%) is the notable red spot in a green industry. The company had such a strong couple of years that the decline in 2022 is not surprising. It’s worth noting that the company still has billions in cash, and its oral antiviral tab could become a big sales driver over the coming year.
The big three companies in the medical distribution industry—McKesson (+50%), Cardinal (+47%), and AmerisourceBergen (+24%)—also had a solid year.
Big Aerospace and Defense Companies
Major defense and aerospace stocks—with the exception of Boeing—outperformed the broader market in 2022.
Northrop Grumman (+41%) saw healthy gains, powered by its space segment. The company will be busy building rocket boosters that will help put Amazon’s 3,000+ communications satellites into orbit in coming years.
Lockheed Martin (+38%) capped off a strong year with a cool half a billion dollar contract from the U.S. Government.
The Losers
2022 was the worst year for the S&P 500 since the 2008 financial crisis. While the markets usually finish up, down years can happen. Last year was one of those rare times.
Unlike the winning side of the equation, there’s no lack of material to cover in this section. We’ve scanned the sea of red for sectors to dig into.
Technology
The tech sector, from semiconductors to software, saw steep declines across the board last year.
The list below, which shows the largest declines in the S&P 500, puts into perspective just how much value was wiped out in the tech sector this year.
| Company | Ticker | Market Cap Change (2022) | % Change (2022) |
|---|---|---|---|
| Apple | AAPL | -$846 billion | -27% |
| Amazon | AMZN | -$834 billion | -50% |
| Microsoft | MSFT | -$737 billion | -29% |
| Tesla | TSLA | -$672 billion | -65% |
| Meta Platforms | META | -$464 billion | -64% |
| Nvidia | NVDA | -$376 billion | -50% |
| PayPal | PYPL | -$140 billion | -62% |
| Netflix | NFLX | -$136 billion | -51% |
| Walt Disney | DIS | -$123 billion | -44% |
| Salesforce | CRM | -$118 billion | -48% |
In absolute terms, Apple is the biggest loser on the year, shedding $846 billion from its market cap. Meta, which is in the midst of building out its vision for a “metaverse”, also saw one of the biggest declines, shedding $464 billion in market cap.
Semiconductor stocks, like NVIDIA (-50%) and TSMC (-38%) were hit particularly hard.
The so-called crypto winter, collapse of NFT transactions, and even bigger collapse of FTX, spelled tough times for any company that specialized in crypto. Although Coinbase avoided any major controversies last year, its stock was still hammered, falling 86% on the year.
Automakers
Last year posed many challenges for U.S. automakers.
Macroeconomic issues aside, simply being able to roll new vehicles off the assembly line proved to be a challenge as supply chain issues persisted.
Tesla saw 40% growth in deliveries last year, but that was not enough to satisfy investors. The automaker’s stock has been plummeting since September, and eventually finished down 65% on the year.
Other pure-play EV companies fared even worse. Rivian and Lucid saw massive 90%+ declines over the course of last year.
Real Estate
Real Estate Investment Trust (REIT) stocks trailed the overall market due to soaring interest rates and uncertain economic circumstances.
This was in stark contrast to 2021, when REITs had one of their best-ever performances.
Though most of this sector is made up of REITs, WeWork is also in the mix. The previously high-flying company saw one of the steepest declines, finishing the year down more than 80%.
The Year Ahead
Many experts believe that a recession is coming, with severity and duration being the main topics of debate.
Other questions remain as well. Will the tech sector continue mass layoffs going into 2023? Will supply chain issues persist? Will offices slowly spring back to life, or has remote work drastically altered the commercial real estate equation? Will the conflict in Ukraine continue, or come to a resolution?
If there’s one thing we’ve learned over the past three years, it’s that predicting the future is anything but easy.
See what hundreds of experts are predicting for 2023 with our Global Forecast Series.


Markets
The European Stock Market: Attractive Valuations Offer Opportunities
On average, the European stock market has valuations that are nearly 50% lower than U.S. valuations. But how can you access the market?


European Stock Market: Attractive Valuations Offer Opportunities
Europe is known for some established brands, from L’Oréal to Louis Vuitton. However, the European stock market offers additional opportunities that may be lesser known.
The above infographic, sponsored by STOXX, outlines why investors may want to consider European stocks.
Attractive Valuations
Compared to most North American and Asian markets, European stocks offer lower or comparable valuations.
| Index | Price-to-Earnings Ratio | Price-to-Book Ratio |
|---|---|---|
| EURO STOXX 50 | 14.9 | 2.2 |
| STOXX Europe 600 | 14.4 | 2 |
| U.S. | 25.9 | 4.7 |
| Canada | 16.1 | 1.8 |
| Japan | 15.4 | 1.6 |
| Asia Pacific ex. China | 17.1 | 1.8 |
Data as of February 29, 2024. See graphic for full index names. Ratios based on trailing 12 month financials. The price to earnings ratio excludes companies with negative earnings.
On average, European valuations are nearly 50% lower than U.S. valuations, potentially offering an affordable entry point for investors.
Research also shows that lower price ratios have historically led to higher long-term returns.
Market Movements Not Closely Connected
Over the last decade, the European stock market had low-to-moderate correlation with North American and Asian equities.
The below chart shows correlations from February 2014 to February 2024. A value closer to zero indicates low correlation, while a value of one would indicate that two regions are moving in perfect unison.
| EURO STOXX 50 | STOXX EUROPE 600 | U.S. | Canada | Japan | Asia Pacific ex. China |
|
|---|---|---|---|---|---|---|
| EURO STOXX 50 | 1.00 | 0.97 | 0.55 | 0.67 | 0.24 | 0.43 |
| STOXX EUROPE 600 | 1.00 | 0.56 | 0.71 | 0.28 | 0.48 | |
| U.S. | 1.00 | 0.73 | 0.12 | 0.25 | ||
| Canada | 1.00 | 0.22 | 0.40 | |||
| Japan | 1.00 | 0.88 | ||||
| Asia Pacific ex. China | 1.00 |
Data is based on daily USD returns.
European equities had relatively independent market movements from North American and Asian markets. One contributing factor could be the differing sector weights in each market. For instance, technology makes up a quarter of the U.S. market, but health care and industrials dominate the broader European market.
Ultimately, European equities can enhance portfolio diversification and have the potential to mitigate risk for investors.
Tracking the Market
For investors interested in European equities, STOXX offers a variety of flagship indices:
| Index | Description | Market Cap |
|---|---|---|
| STOXX Europe 600 | Pan-regional, broad market | €10.5T |
| STOXX Developed Europe | Pan-regional, broad-market | €9.9T |
| STOXX Europe 600 ESG-X | Pan-regional, broad market, sustainability focus | €9.7T |
| STOXX Europe 50 | Pan-regional, blue-chip | €5.1T |
| EURO STOXX 50 | Eurozone, blue-chip | €3.5T |
Data is as of February 29, 2024. Market cap is free float, which represents the shares that are readily available for public trading on stock exchanges.
The EURO STOXX 50 tracks the Eurozone’s biggest and most traded companies. It also underlies one of the world’s largest ranges of ETFs and mutual funds. As of November 2023, there were €27.3 billion in ETFs and €23.5B in mutual fund assets under management tracking the index.
“For the past 25 years, the EURO STOXX 50 has served as an accurate, reliable and tradable representation of the Eurozone equity market.”
— Axel Lomholt, General Manager at STOXX
Partnering with STOXX to Track the European Stock Market
Are you interested in European equities? STOXX can be a valuable partner:
- Comprehensive, liquid and investable ecosystem
- European heritage, global reach
- Highly sophisticated customization capabilities
- Open architecture approach to using data
- Close partnerships with clients
- Part of ISS STOXX and Deutsche Börse Group
With a full suite of indices, STOXX can help you benchmark against the European stock market.
Learn how STOXX’s European indices offer liquid and effective market access.

-

 Economy2 days ago
Economic Growth Forecasts for G7 and BRICS Countries in 2024
The IMF has released its economic growth forecasts for 2024. How do the G7 and BRICS countries compare?
-

 Markets1 week ago
U.S. Debt Interest Payments Reach $1 Trillion
U.S. debt interest payments have surged past the $1 trillion dollar mark, amid high interest rates and an ever-expanding debt burden.
-

 United States2 weeks ago
Ranked: The Largest U.S. Corporations by Number of Employees
We visualized the top U.S. companies by employees, revealing the massive scale of retailers like Walmart, Target, and Home Depot.
-

 Markets2 weeks ago
The Top 10 States by Real GDP Growth in 2023
This graphic shows the states with the highest real GDP growth rate in 2023, largely propelled by the oil and gas boom.
-

 Markets2 weeks ago
Ranked: The World’s Top Flight Routes, by Revenue
In this graphic, we show the highest earning flight routes globally as air travel continued to rebound in 2023.
-

 Markets3 weeks ago
Ranked: The Most Valuable Housing Markets in America
The U.S. residential real estate market is worth a staggering $47.5 trillion. Here are the most valuable housing markets in the country.


-

 Education1 week ago
How Hard Is It to Get Into an Ivy League School?
-

 Technology2 weeks ago
Ranked: Semiconductor Companies by Industry Revenue Share
-
Markets2 weeks ago
Ranked: The World’s Top Flight Routes, by Revenue
-

 Demographics2 weeks ago
Population Projections: The World’s 6 Largest Countries in 2075
-
Markets2 weeks ago
The Top 10 States by Real GDP Growth in 2023
-

 Demographics2 weeks ago
The Smallest Gender Wage Gaps in OECD Countries
-

 Economy2 weeks ago
Where U.S. Inflation Hit the Hardest in March 2024
-

 Green2 weeks ago
Top Countries By Forest Growth Since 2001