Money
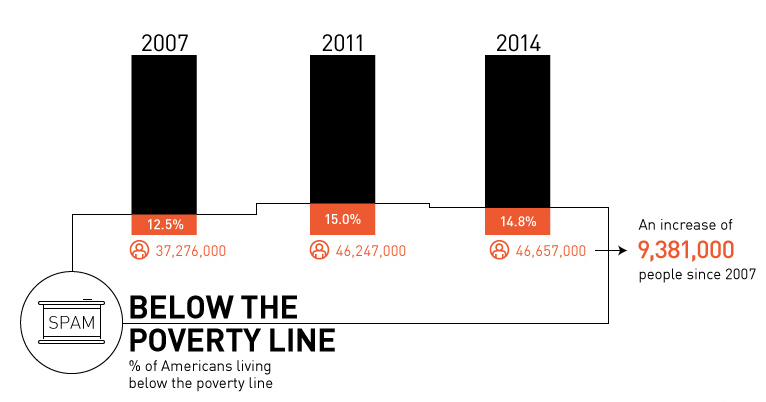
9.4 Million More Americans Below Poverty Line Than Pre-Crisis [Chart]
![9.4 Million More Americans Below Poverty Line Than Pre-Crisis [Chart]](https://www.visualcapitalist.com/wp-content/uploads/2015/09/what-recovery-chart.jpg)
What Recovery? [Chart]
9.4 Million More Americans Below Poverty Line Than Pre-Crisis
The Chart of the Week is a weekly Visual Capitalist feature on Fridays.
According to Janet Yellen, we are still on pace to raise rates in 2015. While the rate hike was supposed to happen this month, it got derailed by the August market selloff, volatility in China, lackluster work force numbers, and a variety of other factors.
Despite the Fed continuing to kick this down the road, they continue to claim that we are in the middle of an ongoing recovery. There’s just one problem with that: things are getting worse than pre-crisis levels for millions of the poorest Americans.
It’s true that the wealthiest 10% of Americans have finally seen their household incomes rise above the levels last seen in 2007. It’s also true that median incomes have “recovered” from the worst of the 2008 disaster. Median earners were -8.1% worse off in 2011, and now they are only -6.5% worse off according to most recent data for 2014 released by the U.S. Census Bureau last week.
However, when we look at the lowest 10% of income earners, the situation is much more precarious. In 2011, the bottom 10% of households were -9.0% worse off in terms of income than they were pre-crisis. Since then, it hasn’t gotten any better: they now are making -11.6% less income than they were in 2007.
Possibly even more concerning is the fact that the amount of Americans living below the poverty line has soared since 2007. There are now 9.4 million more people that can claim to be a part of this unfortunate group, and the total contingent living below the poverty line now makes up 14.8% of all Americans. This is also an increase from the 12.5% figure from before the Great Recession.
What’s the difference between 2007 and today? One stark contrast is the fact that the Fed’s balance sheet has exploded by adding $3.5 trillion of phony money to its balance sheet (that’s about the size of Germany’s economy) with its Quantitative Easing (QE) program. As part of the same experiment, it kept rates artificially low at near 0% for a record amount of time to encourage both lending and economic growth.
However, it is seven years later, and we are starting to see the fruits of this experiment especially in terms of wealth inequality. Studies and economists are starting to sound off, noting that QE and ZIRP have been a failure for America’s poorest. We explained the basics in a previous chart, but here’s some other articles worth reading from Forbes, WSJ, and SCMP that help show the effect of these policies.
By the way, the St. Louis Fed has essentially admitted QE was a mistake, while the Philadelphia Fed also admitted that these policies likely helped cause income inequality. Even fragilista economist Joseph Stiglitz has said this summer that ZIRP has helped increase income inequality.


Money
Charted: Which City Has the Most Billionaires in 2024?
Just two countries account for half of the top 20 cities with the most billionaires. And the majority of the other half are found in Asia.


Charted: Which Country Has the Most Billionaires in 2024?
This was originally posted on our Voronoi app. Download the app for free on iOS or Android and discover incredible data-driven charts from a variety of trusted sources.
Some cities seem to attract the rich. Take New York City for example, which has 340,000 high-net-worth residents with investable assets of more than $1 million.
But there’s a vast difference between being a millionaire and a billionaire. So where do the richest of them all live?
Using data from the Hurun Global Rich List 2024, we rank the top 20 cities with the highest number of billionaires in 2024.
A caveat to these rich lists: sources often vary on figures and exact rankings. For example, in last year’s reports, Forbes had New York as the city with the most billionaires, while the Hurun Global Rich List placed Beijing at the top spot.
Ranked: Top 20 Cities with the Most Billionaires in 2024
The Chinese economy’s doldrums over the course of the past year have affected its ultra-wealthy residents in key cities.
Beijing, the city with the most billionaires in 2023, has not only ceded its spot to New York, but has dropped to #4, overtaken by London and Mumbai.
| Rank | City | Billionaires | Rank Change YoY |
|---|---|---|---|
| 1 | 🇺🇸 New York | 119 | +1 |
| 2 | 🇬🇧 London | 97 | +3 |
| 3 | 🇮🇳 Mumbai | 92 | +4 |
| 4 | 🇨🇳 Beijing | 91 | -3 |
| 5 | 🇨🇳 Shanghai | 87 | -2 |
| 6 | 🇨🇳 Shenzhen | 84 | -2 |
| 7 | 🇭🇰 Hong Kong | 65 | -1 |
| 8 | 🇷🇺 Moscow | 59 | No Change |
| 9 | 🇮🇳 New Delhi | 57 | +6 |
| 10 | 🇺🇸 San Francisco | 52 | No Change |
| 11 | 🇹🇭 Bangkok | 49 | +2 |
| 12 | 🇹🇼 Taipei | 45 | +2 |
| 13 | 🇫🇷 Paris | 44 | -2 |
| 14 | 🇨🇳 Hangzhou | 43 | -5 |
| 15 | 🇸🇬 Singapore | 42 | New to Top 20 |
| 16 | 🇨🇳 Guangzhou | 39 | -4 |
| 17T | 🇮🇩 Jakarta | 37 | +1 |
| 17T | 🇧🇷 Sao Paulo | 37 | No Change |
| 19T | 🇺🇸 Los Angeles | 31 | No Change |
| 19T | 🇰🇷 Seoul | 31 | -3 |
In fact all Chinese cities on the top 20 list have lost billionaires between 2023–24. Consequently, they’ve all lost ranking spots as well, with Hangzhou seeing the biggest slide (-5) in the top 20.
Where China lost, all other Asian cities—except Seoul—in the top 20 have gained ranks. Indian cities lead the way, with New Delhi (+6) and Mumbai (+3) having climbed the most.
At a country level, China and the U.S combine to make up half of the cities in the top 20. They are also home to about half of the world’s 3,200 billionaire population.
In other news of note: Hurun officially counts Taylor Swift as a billionaire, estimating her net worth at $1.2 billion.

-

 Energy1 week ago
The World’s Biggest Nuclear Energy Producers
-

 Money2 weeks ago
Which States Have the Highest Minimum Wage in America?
-

 Technology2 weeks ago
Ranked: Semiconductor Companies by Industry Revenue Share
-

 Markets2 weeks ago
Ranked: The World’s Top Flight Routes, by Revenue
-

 Countries2 weeks ago
Population Projections: The World’s 6 Largest Countries in 2075
-

 Markets2 weeks ago
The Top 10 States by Real GDP Growth in 2023
-

 Demographics2 weeks ago
The Smallest Gender Wage Gaps in OECD Countries
-

 United States2 weeks ago
Where U.S. Inflation Hit the Hardest in March 2024