Markets
$69 Trillion of World Debt in One Infographic
Get this infographic as a poster (and save 15% by being a VC+ member)


$69 Trillion of World Debt in One Infographic
Two decades ago, total government debt was estimated to sit at $20 trillion.
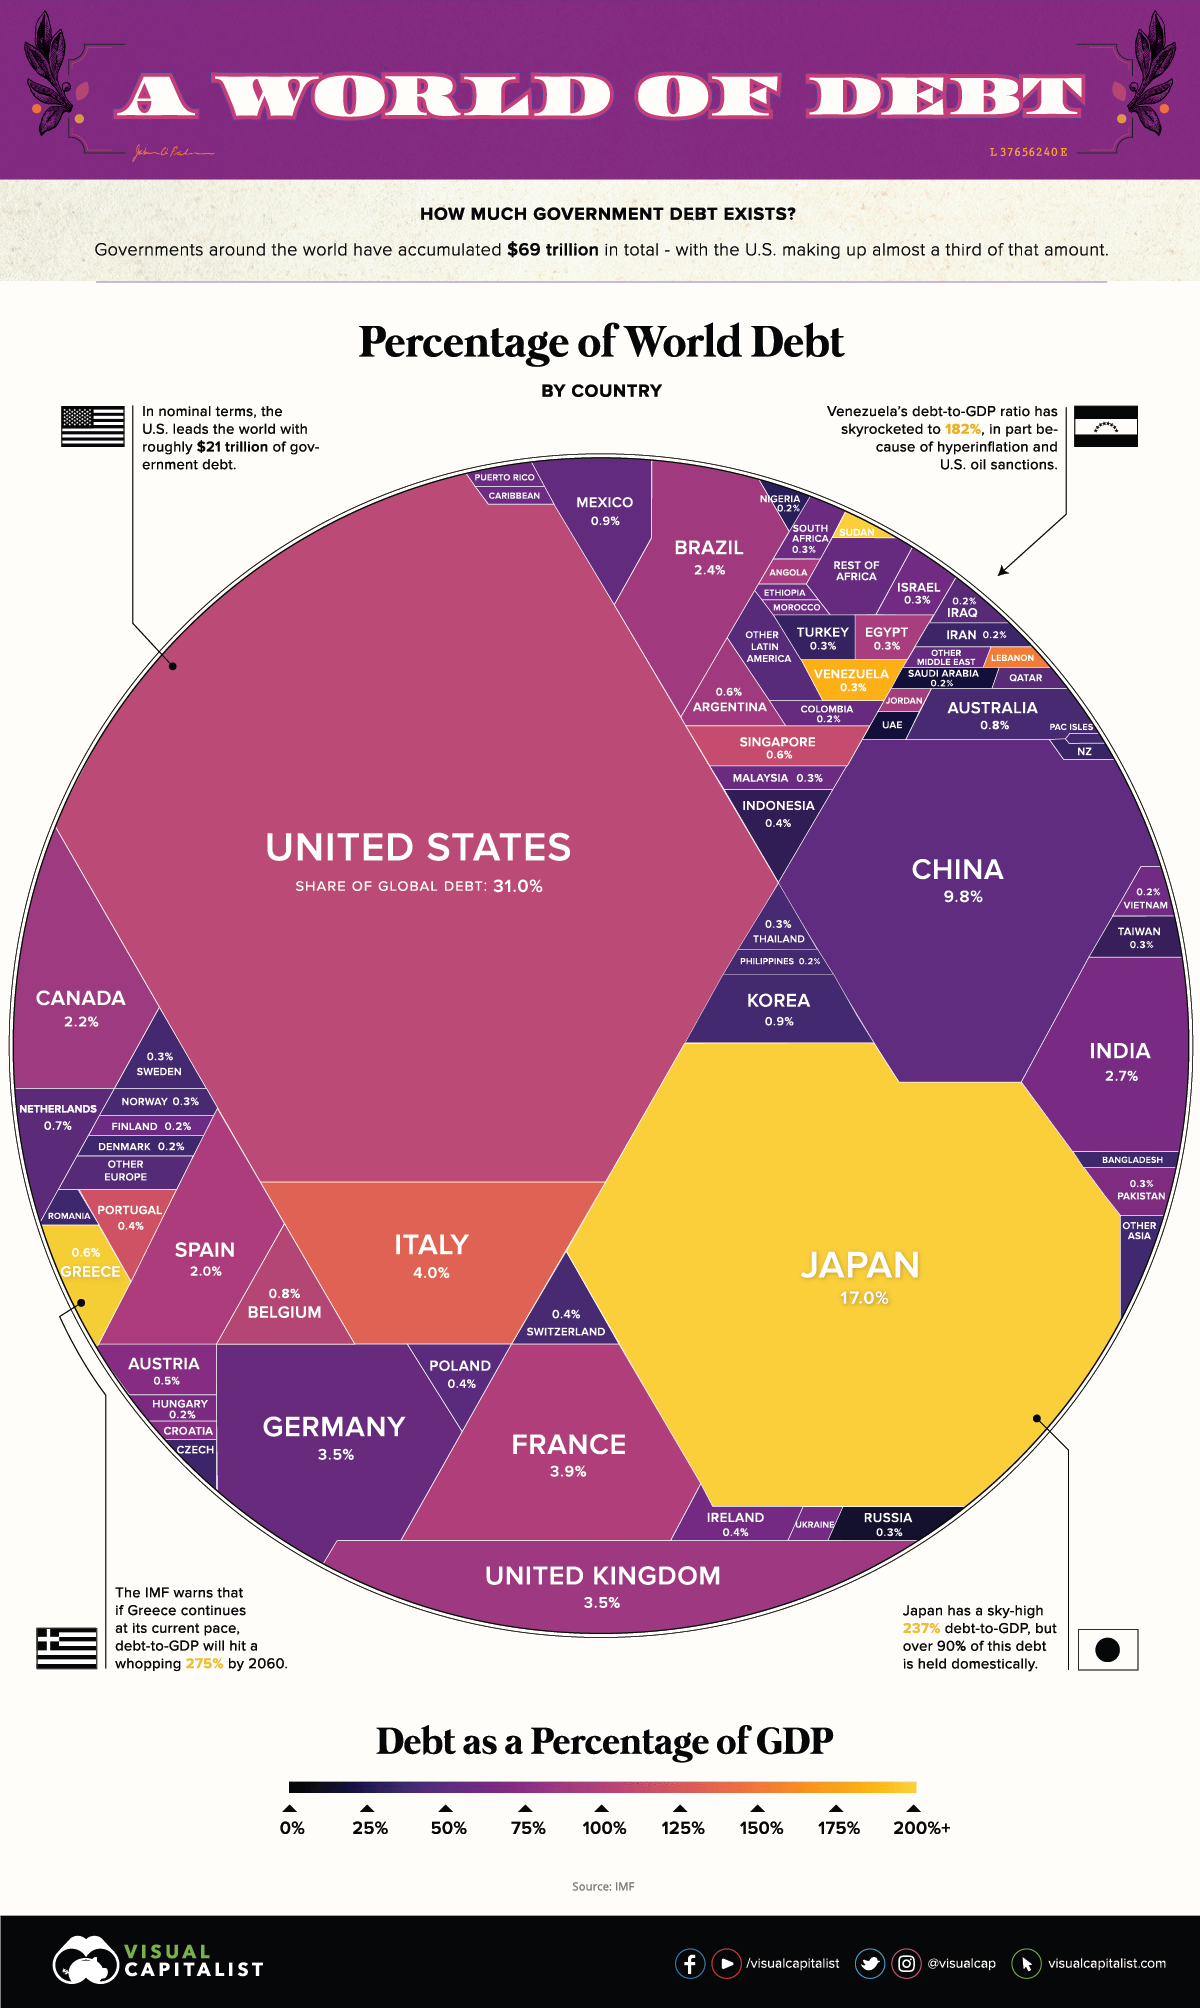
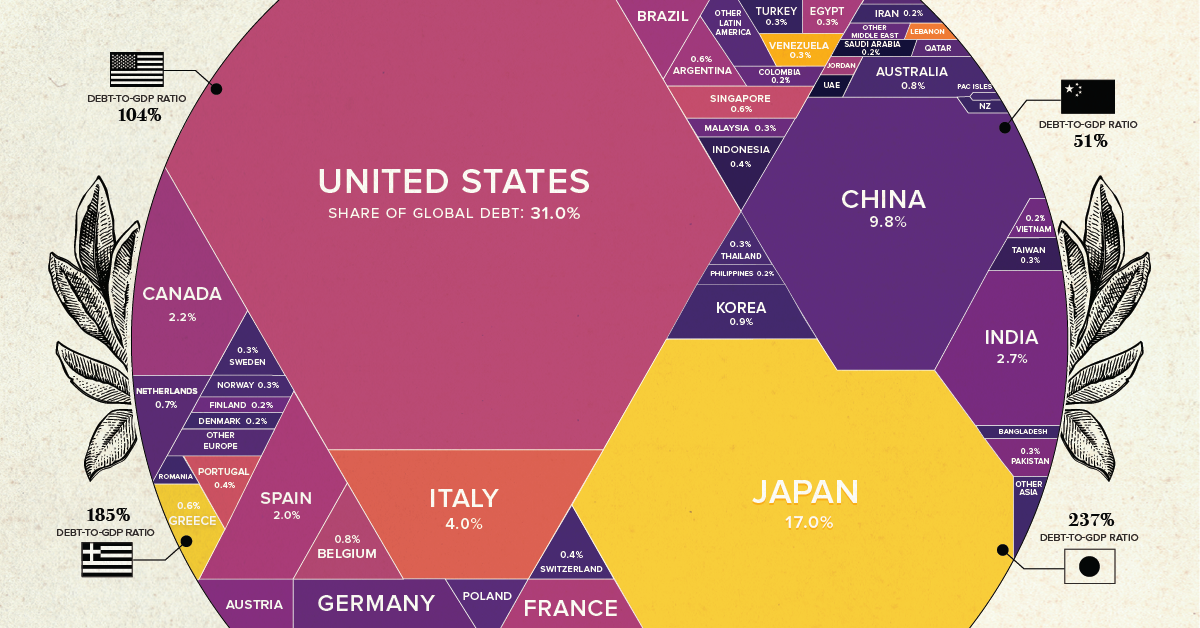
Since then, according to the latest figures by the IMF, the number has ballooned to $69.3 trillion with a debt to GDP ratio of 82% — the highest totals in human history.
Which countries owe the most money, and how do these figures compare?
The Regional Breakdown
Let’s start by looking at the continental level, to get an idea of how world debt is divided from a geographical perspective:
| Region | Debt to GDP | Gross Debt (Billions of USD) | % of Total World Debt |
|---|---|---|---|
| Asia and Pacific | 79.8% | $24,120 | 34.8% |
| North America | 100.4% | $23,710 | 34.2% |
| Europe | 74.2% | $16,225 | 23.4% |
| South America | 75.0% | $2,699 | 3.9% |
| Africa | 56.9% | $1,313 | 1.9% |
| Other | 37.1% | $1,231 | 1.8% |
| World | 81.8% | $69,298 | 100.0% |
In absolute terms, over 90% of global debt is concentrated in North America, Asia Pacific, and Europe — meanwhile, regions like Africa, South America, and other account for less than 10%.
This is not surprising, since advanced economies hold most of the world’s debt (about 75.4%), while emerging or developing economies hold the rest.
World Debt by Country
Now let’s look at individual countries, according to data released by the IMF in October 2019.
It’s worth mentioning that the following numbers are representative of 2018 data, and that for a tiny subset of countries (i.e. Syria) we used the latest available numbers as an estimate.
| Rank | Country | Debt to GDP | Gross Debt ($B) | % of World Total |
|---|---|---|---|---|
| #1 | 🇺🇸 United States | 104.3% | $21,465 | 31.0% |
| #2 | 🇯🇵 Japan | 237.1% | $11,788 | 17.0% |
| #3 | 🇨🇳 China, People's Republic of | 50.6% | $6,764 | 9.8% |
| #4 | 🇮🇹 Italy | 132.2% | $2,744 | 4.0% |
| #5 | 🇫🇷 France | 98.4% | $2,736 | 3.9% |
| #6 | 🇬🇧 United Kingdom | 86.8% | $2,455 | 3.5% |
| #7 | 🇩🇪 Germany | 61.7% | $2,438 | 3.5% |
| #8 | 🇮🇳 India | 68.1% | $1,851 | 2.7% |
| #9 | 🇧🇷 Brazil | 87.9% | $1,642 | 2.4% |
| #10 | 🇨🇦 Canada | 89.9% | $1,540 | 2.2% |
| #11 | 🇪🇸 Spain | 97.1% | $1,386 | 2.0% |
| #12 | 🇲🇽 Mexico | 53.6% | $655 | 0.9% |
| #13 | 🇰🇷 Korea, Republic of | 37.9% | $652 | 0.9% |
| #14 | 🇦🇺 Australia | 41.4% | $588 | 0.8% |
| #15 | 🇧🇪 Belgium | 102.0% | $543 | 0.8% |
| #16 | Netherlands | 52.4% | $479 | 0.7% |
| #17 | Argentina | 86.1% | $447 | 0.6% |
| #18 | Singapore | 113.6% | $414 | 0.6% |
| #19 | Greece | 184.9% | $404 | 0.6% |
| #20 | Austria | 73.8% | $337 | 0.5% |
| #21 | Indonesia | 30.1% | $308 | 0.4% |
| #22 | Portugal | 120.1% | $289 | 0.4% |
| #23 | Poland | 48.9% | $286 | 0.4% |
| #24 | Switzerland | 40.5% | $286 | 0.4% |
| #25 | Ireland | 63.7% | $244 | 0.4% |
| #26 | Russian Federation | 14.6% | $242 | 0.3% |
| #27 | Turkey | 30.2% | $233 | 0.3% |
| #28 | Egypt | 92.7% | $231 | 0.3% |
| #29 | Pakistan | 71.7% | $226 | 0.3% |
| #30 | Israel | 60.8% | $225 | 0.3% |
| #31 | Sweden | 38.5% | $214 | 0.3% |
| #32 | Thailand | 42.1% | $213 | 0.3% |
| #33 | South Africa | 56.7% | $209 | 0.3% |
| #34 | Taiwan Province of China | 35.1% | $207 | 0.3% |
| #35 | Malaysia | 55.6% | $199 | 0.3% |
| #36 | Venezuela | 182.4% | $180 | 0.3% |
| #37 | Norway | 40.0% | $174 | 0.3% |
| #38 | Colombia | 52.2% | $173 | 0.2% |
| #39 | Finland | 59.3% | $163 | 0.2% |
| #40 | Saudi Arabia | 19.0% | $149 | 0.2% |
| #41 | Iran | 32.2% | $144 | 0.2% |
| #42 | Vietnam | 55.6% | $134 | 0.2% |
| #43 | Philippines | 38.9% | $129 | 0.2% |
| #44 | Denmark | 34.3% | $121 | 0.2% |
| #45 | Hungary | 70.8% | $114 | 0.2% |
| #46 | Iraq | 49.3% | $111 | 0.2% |
| #47 | Nigeria | 27.3% | $109 | 0.2% |
| #48 | Bangladesh | 34.0% | $98.1 | 0.14% |
| #49 | Angola | 89.0% | $94.3 | 0.14% |
| #50 | Qatar | 48.6% | $93.0 | 0.13% |
| #51 | Romania | 36.7% | $87.9 | 0.13% |
| #52 | Lebanon | 151.0% | $85.1 | 0.12% |
| #53 | Czech Republic | 32.6% | $79.9 | 0.12% |
| #54 | United Arab Emirates | 19.1% | $79.1 | 0.11% |
| #55 | Ukraine | 60.2% | $78.8 | 0.11% |
| #56 | Morocco | 65.0% | $77.0 | 0.11% |
| #57 | Chile | 25.6% | $76.3 | 0.11% |
| #58 | Sri Lanka | 83.3% | $74.1 | 0.11% |
| #59 | Sudan | 212.1% | $72.7 | 0.10% |
| #60 | Algeria | 38.3% | $66.5 | 0.10% |
| #61 | New Zealand | 29.8% | $60.5 | 0.09% |
| #62 | Peru | 26.1% | $58.8 | 0.08% |
| #63 | Puerto Rico | 55.5% | $56.1 | 0.08% |
| #64 | Kenya | 60.1% | $52.8 | 0.08% |
| #65 | Slovak Republic | 48.9% | $52.1 | 0.08% |
| #66 | Ecuador | 45.8% | $49.6 | 0.07% |
| #67 | Ethiopia | 61.0% | $49.0 | 0.07% |
| #68 | Croatia | 74.6% | $45.4 | 0.07% |
| #69 | Dominican Republic | 50.5% | $43.2 | 0.06% |
| #70 | Oman | 53.4% | $42.3 | 0.06% |
| #71 | Jordan | 94.4% | $39.9 | 0.06% |
| #72 | Ghana | 59.3% | $38.9 | 0.06% |
| #73 | Slovenia | 70.4% | $38.1 | 0.05% |
| #74 | Uruguay | 63.5% | $37.9 | 0.05% |
| #75 | Kazakhstan | 21.0% | $36.3 | 0.05% |
| #76 | Bahrain | 94.7% | $35.7 | 0.05% |
| #77 | Costa Rica | 53.5% | $32.3 | 0.05% |
| #78 | Tunisia | 77.0% | $30.7 | 0.04% |
| #79 | Belarus | 47.8% | $28.5 | 0.04% |
| #80 | Serbia | 54.5% | $27.5 | 0.04% |
| #81 | Myanmar | 38.2% | $26.2 | 0.04% |
| #82 | Panama | 39.5% | $25.7 | 0.04% |
| #83 | Cyprus | 102.5% | $25.1 | 0.04% |
| #84 | Côte d'Ivoire | 53.2% | $22.9 | 0.03% |
| #85 | Bolivia | 53.8% | $21.8 | 0.03% |
| #86 | Tanzania | 37.3% | $21.2 | 0.03% |
| #87 | Zambia | 78.1% | $20.9 | 0.03% |
| #88 | Kuwait | 14.7% | $20.8 | 0.03% |
| #89 | Guatemala | 24.7% | $19.4 | 0.03% |
| #90 | Lithuania | 34.2% | $18.2 | 0.03% |
| #91 | Syria | 30.0% | $18.0 | 0.03% |
| #92 | Yemen | 64.8% | $17.9 | 0.03% |
| #93 | El Salvador | 67.1% | $17.5 | 0.03% |
| #94 | Cameroon | 39.1% | $15.1 | 0.02% |
| #95 | Luxembourg | 21.4% | $14.9 | 0.02% |
| #96 | Jamaica | 94.4% | $14.6 | 0.02% |
| #97 | Senegal | 61.6% | $14.5 | 0.02% |
| #98 | Mozambique | 99.8% | $14.4 | 0.02% |
| #99 | Bulgaria | 20.4% | $13.3 | 0.02% |
| #100 | Latvia | 35.9% | $12.5 | 0.02% |
| #101 | Turkmenistan | 29.1% | $11.9 | 0.02% |
| #102 | Uganda | 41.4% | $11.6 | 0.02% |
| #103 | Albania | 69.9% | $10.5 | 0.02% |
| #104 | Uzbekistan | 20.6% | $10.4 | 0.02% |
| #105 | Lao P.D.R. | 57.2% | $10.4 | 0.01% |
| #106 | Gabon | 60.7% | $10.2 | 0.01% |
| #107 | Congo, Republic of | 87.8% | $10.2 | 0.01% |
| #108 | Trinidad and Tobago | 45.1% | $10.2 | 0.01% |
| #109 | Iceland | 37.6% | $9.8 | 0.01% |
| #110 | Honduras | 40.2% | $9.6 | 0.01% |
| #111 | Mauritius | 66.2% | $9.4 | 0.01% |
| #112 | Paraguay | 21.5% | $9.0 | 0.01% |
| #113 | Azerbaijan | 18.8% | $8.8 | 0.01% |
| #114 | Nepal | 30.2% | $8.8 | 0.01% |
| #115 | Papua New Guinea | 35.5% | $8.2 | 0.01% |
| #116 | Bahamas, The | 63.3% | $7.9 | 0.01% |
| #117 | Zimbabwe | 37.1% | $7.8 | 0.01% |
| #118 | Georgia | 44.9% | $7.3 | 0.01% |
| #119 | Congo, Dem. Rep. of the | 15.3% | $7.2 | 0.01% |
| #120 | Cambodia | 28.6% | $7.0 | 0.01% |
| #121 | Bosnia and Herzegovina | 34.3% | $6.9 | 0.01% |
| #122 | Namibia | 45.8% | $6.6 | 0.01% |
| #123 | Malta | 45.2% | $6.6 | 0.01% |
| #124 | Mali | 37.3% | $6.4 | 0.01% |
| #125 | Barbados | 125.7% | $6.4 | 0.01% |
| #126 | Armenia | 51.3% | $6.4 | 0.01% |
| #127 | Burkina Faso | 42.9% | $6.1 | 0.01% |
| #128 | Equatorial Guinea | 43.3% | $5.9 | 0.01% |
| #129 | Benin | 41.0% | $5.9 | 0.01% |
| #130 | Madagascar | 45.7% | $5.5 | 0.01% |
| #131 | Chad | 48.3% | $5.3 | 0.01% |
| #132 | North Macedonia | 40.5% | $5.1 | 0.01% |
| #133 | Niger | 53.8% | $5.0 | 0.01% |
| #134 | Nicaragua | 37.2% | $4.9 | 0.01% |
| #135 | Guinea | 38.2% | $4.6 | 0.01% |
| #136 | Kyrgyz Republic | 56.0% | $4.5 | 0.01% |
| #137 | Mauritania | 82.9% | $4.3 | 0.01% |
| #138 | Malawi | 62.9% | $4.3 | 0.01% |
| #139 | Togo | 76.2% | $4.1 | 0.01% |
| #140 | Montenegro | 72.6% | $4.0 | 0.01% |
| #141 | Rwanda | 40.7% | $3.9 | 0.01% |
| #142 | Maldives | 68.0% | $3.6 | 0.01% |
| #143 | Tajikistan | 47.9% | $3.6 | 0.01% |
| #144 | Eritrea | 174.3% | $3.5 | 0.01% |
| #145 | Moldova | 29.7% | $3.4 | 0.00% |
| #146 | Haiti | 33.3% | $3.2 | 0.00% |
| #147 | Bhutan | 102.4% | $2.6 | 0.00% |
| #148 | Sierra Leone | 63.0% | $2.6 | 0.00% |
| #149 | Estonia | 8.3% | $2.6 | 0.00% |
| #150 | Fiji | 46.2% | $2.6 | 0.00% |
| #151 | Suriname | 72.8% | $2.5 | 0.00% |
| #152 | Cabo Verde | 124.5% | $2.5 | 0.00% |
| #153 | Aruba | 84.5% | $2.4 | 0.00% |
| #154 | Botswana | 12.1% | $2.3 | 0.00% |
| #155 | Guyana | 52.9% | $2.1 | 0.00% |
| #156 | Burundi | 58.4% | $2.0 | 0.00% |
| #157 | South Sudan, Republic of | 42.2% | $1.9 | 0.00% |
| #158 | Belize | 95.2% | $1.8 | 0.00% |
| #159 | Eswatini | 35.2% | $1.7 | 0.00% |
| #160 | Antigua and Barbuda | 89.5% | $1.4 | 0.00% |
| #161 | Gambia, The | 86.6% | $1.4 | 0.00% |
| #162 | Djibouti | 48.0% | $1.4 | 0.00% |
| #163 | Afghanistan | 6.9% | $1.4 | 0.00% |
| #164 | Kosovo | 17.0% | $1.4 | 0.00% |
| #165 | Liberia | 39.9% | $1.3 | 0.00% |
| #166 | San Marino | 77.9% | $1.3 | 0.00% |
| #167 | Saint Lucia | 64.3% | $1.2 | 0.00% |
| #168 | Lesotho | 44.5% | $1.2 | 0.00% |
| #169 | Central African Republic | 49.9% | $1.1 | 0.00% |
| #170 | Guinea-Bissau | 64.3% | $0.9 | 0.00% |
| #171 | Seychelles | 56.9% | $0.9 | 0.00% |
| #172 | Grenada | 63.5% | $0.8 | 0.00% |
| #173 | Saint Vincent and the Grenadines | 74.5% | $0.6 | 0.00% |
| #174 | Saint Kitts and Nevis | 60.5% | $0.6 | 0.00% |
| #175 | Vanuatu | 51.4% | $0.5 | 0.00% |
| #176 | Samoa | 50.3% | $0.4 | 0.00% |
| #177 | Dominica | 74.1% | $0.4 | 0.00% |
| #178 | Hong Kong SAR | 0.1% | $0.4 | 0.00% |
| #179 | Brunei Darussalam | 2.6% | $0.4 | 0.00% |
| #180 | São Tomé and Príncipe | 74.5% | $0.3 | 0.00% |
| #181 | Comoros | 21.0% | $0.2 | 0.00% |
| #182 | Timor-Leste | 6.1% | $0.2 | 0.00% |
| #183 | Solomon Islands | 9.4% | $0.1 | 0.00% |
| #184 | Micronesia, Fed. States of | 20.3% | $0.1 | 0.00% |
| #185 | Nauru | 58.3% | $0.1 | 0.00% |
| #186 | Marshall Islands | 25.2% | $0.1 | 0.00% |
| #187 | Kiribati | 20.6% | $0.0 | 0.00% |
| #188 | Tuvalu | 28.1% | $0.0 | 0.00% |
In absolute terms, the most indebted nation is the United States, which has a gross debt of $21.5 trillion according to the IMF as of 2018.
If you’re looking for a more precise figure for 2019, the U.S. government’s “Debt to the Penny” dataset puts the amount owing to exactly $23,015,089,744,090.63 as of November 12, 2019.
Of course, the U.S. is also the world’s largest economy in nominal terms, putting the debt to GDP ratio at 104.3%
Other stand outs from the list above include Japan, which has the highest debt to GDP ratio (237.1%), and China , which has increased government debt by almost $2 trillion in just the last two years. Meanwhile, the European economies of Italy and Belgium check the box as other large debtors with ratios topping 100% debt to GDP.


Markets
The European Stock Market: Attractive Valuations Offer Opportunities
On average, the European stock market has valuations that are nearly 50% lower than U.S. valuations. But how can you access the market?


European Stock Market: Attractive Valuations Offer Opportunities
Europe is known for some established brands, from L’Oréal to Louis Vuitton. However, the European stock market offers additional opportunities that may be lesser known.
The above infographic, sponsored by STOXX, outlines why investors may want to consider European stocks.
Attractive Valuations
Compared to most North American and Asian markets, European stocks offer lower or comparable valuations.
| Index | Price-to-Earnings Ratio | Price-to-Book Ratio |
|---|---|---|
| EURO STOXX 50 | 14.9 | 2.2 |
| STOXX Europe 600 | 14.4 | 2 |
| U.S. | 25.9 | 4.7 |
| Canada | 16.1 | 1.8 |
| Japan | 15.4 | 1.6 |
| Asia Pacific ex. China | 17.1 | 1.8 |
Data as of February 29, 2024. See graphic for full index names. Ratios based on trailing 12 month financials. The price to earnings ratio excludes companies with negative earnings.
On average, European valuations are nearly 50% lower than U.S. valuations, potentially offering an affordable entry point for investors.
Research also shows that lower price ratios have historically led to higher long-term returns.
Market Movements Not Closely Connected
Over the last decade, the European stock market had low-to-moderate correlation with North American and Asian equities.
The below chart shows correlations from February 2014 to February 2024. A value closer to zero indicates low correlation, while a value of one would indicate that two regions are moving in perfect unison.
| EURO STOXX 50 | STOXX EUROPE 600 | U.S. | Canada | Japan | Asia Pacific ex. China |
|
|---|---|---|---|---|---|---|
| EURO STOXX 50 | 1.00 | 0.97 | 0.55 | 0.67 | 0.24 | 0.43 |
| STOXX EUROPE 600 | 1.00 | 0.56 | 0.71 | 0.28 | 0.48 | |
| U.S. | 1.00 | 0.73 | 0.12 | 0.25 | ||
| Canada | 1.00 | 0.22 | 0.40 | |||
| Japan | 1.00 | 0.88 | ||||
| Asia Pacific ex. China | 1.00 |
Data is based on daily USD returns.
European equities had relatively independent market movements from North American and Asian markets. One contributing factor could be the differing sector weights in each market. For instance, technology makes up a quarter of the U.S. market, but health care and industrials dominate the broader European market.
Ultimately, European equities can enhance portfolio diversification and have the potential to mitigate risk for investors.
Tracking the Market
For investors interested in European equities, STOXX offers a variety of flagship indices:
| Index | Description | Market Cap |
|---|---|---|
| STOXX Europe 600 | Pan-regional, broad market | €10.5T |
| STOXX Developed Europe | Pan-regional, broad-market | €9.9T |
| STOXX Europe 600 ESG-X | Pan-regional, broad market, sustainability focus | €9.7T |
| STOXX Europe 50 | Pan-regional, blue-chip | €5.1T |
| EURO STOXX 50 | Eurozone, blue-chip | €3.5T |
Data is as of February 29, 2024. Market cap is free float, which represents the shares that are readily available for public trading on stock exchanges.
The EURO STOXX 50 tracks the Eurozone’s biggest and most traded companies. It also underlies one of the world’s largest ranges of ETFs and mutual funds. As of November 2023, there were €27.3 billion in ETFs and €23.5B in mutual fund assets under management tracking the index.
“For the past 25 years, the EURO STOXX 50 has served as an accurate, reliable and tradable representation of the Eurozone equity market.”
— Axel Lomholt, General Manager at STOXX
Partnering with STOXX to Track the European Stock Market
Are you interested in European equities? STOXX can be a valuable partner:
- Comprehensive, liquid and investable ecosystem
- European heritage, global reach
- Highly sophisticated customization capabilities
- Open architecture approach to using data
- Close partnerships with clients
- Part of ISS STOXX and Deutsche Börse Group
With a full suite of indices, STOXX can help you benchmark against the European stock market.
Learn how STOXX’s European indices offer liquid and effective market access.

-

 Economy1 day ago
Economic Growth Forecasts for G7 and BRICS Countries in 2024
The IMF has released its economic growth forecasts for 2024. How do the G7 and BRICS countries compare?
-

 Markets1 week ago
U.S. Debt Interest Payments Reach $1 Trillion
U.S. debt interest payments have surged past the $1 trillion dollar mark, amid high interest rates and an ever-expanding debt burden.
-

 United States1 week ago
Ranked: The Largest U.S. Corporations by Number of Employees
We visualized the top U.S. companies by employees, revealing the massive scale of retailers like Walmart, Target, and Home Depot.
-

 Markets2 weeks ago
The Top 10 States by Real GDP Growth in 2023
This graphic shows the states with the highest real GDP growth rate in 2023, largely propelled by the oil and gas boom.
-

 Markets2 weeks ago
Ranked: The World’s Top Flight Routes, by Revenue
In this graphic, we show the highest earning flight routes globally as air travel continued to rebound in 2023.
-

 Markets2 weeks ago
Ranked: The Most Valuable Housing Markets in America
The U.S. residential real estate market is worth a staggering $47.5 trillion. Here are the most valuable housing markets in the country.

-

 Mining1 week ago
Gold vs. S&P 500: Which Has Grown More Over Five Years?
-
Markets2 weeks ago
Ranked: The Most Valuable Housing Markets in America
-

 Money2 weeks ago
Which States Have the Highest Minimum Wage in America?
-

 AI2 weeks ago
Ranked: Semiconductor Companies by Industry Revenue Share
-
Markets2 weeks ago
Ranked: The World’s Top Flight Routes, by Revenue
-

 Demographics2 weeks ago
Population Projections: The World’s 6 Largest Countries in 2075
-
Markets2 weeks ago
The Top 10 States by Real GDP Growth in 2023
-

 Demographics2 weeks ago
The Smallest Gender Wage Gaps in OECD Countries