Markets
Visualizing 200 Years of U.S. Stock Market Sectors


Visualizing 200 Years of U.S. Stock Market Sectors
If you could travel back in time to the 19th century, it would be very difficult to convince anyone that railroad investments were not the future of the stock market.
Governments were offering subsidies and land grants to stimulate rapid industry growth – and in the period of 1868-1873, just after the American Civil War, an astonishing 33,000 miles of new railroad track were laid.
Entrepreneurs and financiers started betting on ambitious enterprises like the Northern Pacific Railway – and as the transportation boom raged on, more than 60% of total U.S. stock market capitalization came from railroad related stocks.
20/20 Hindsight
We know today that the railroad boom didn’t live up to the expectations drawn out by speculators.
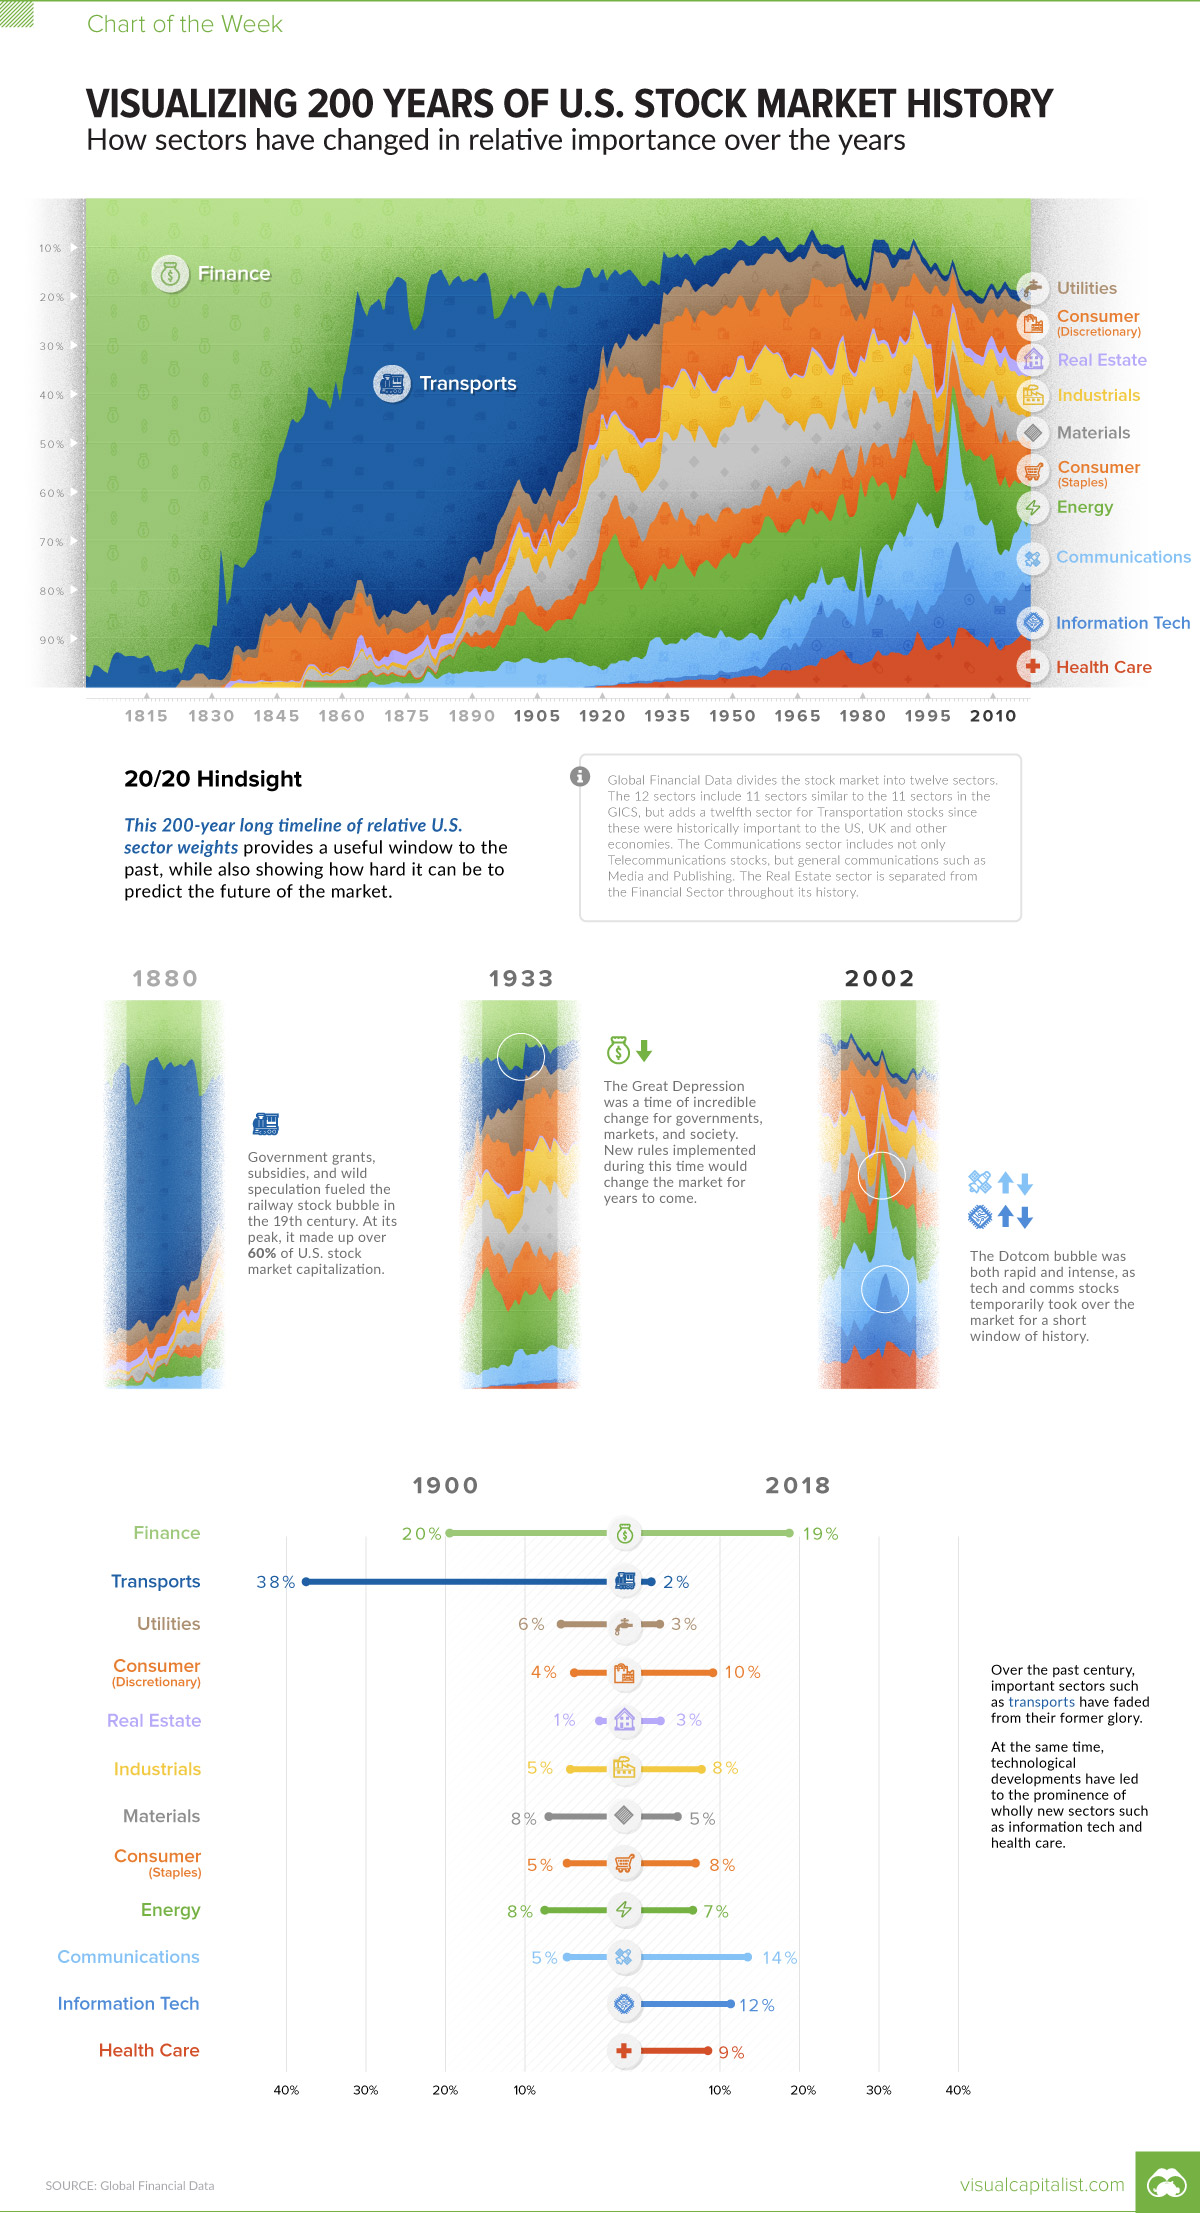
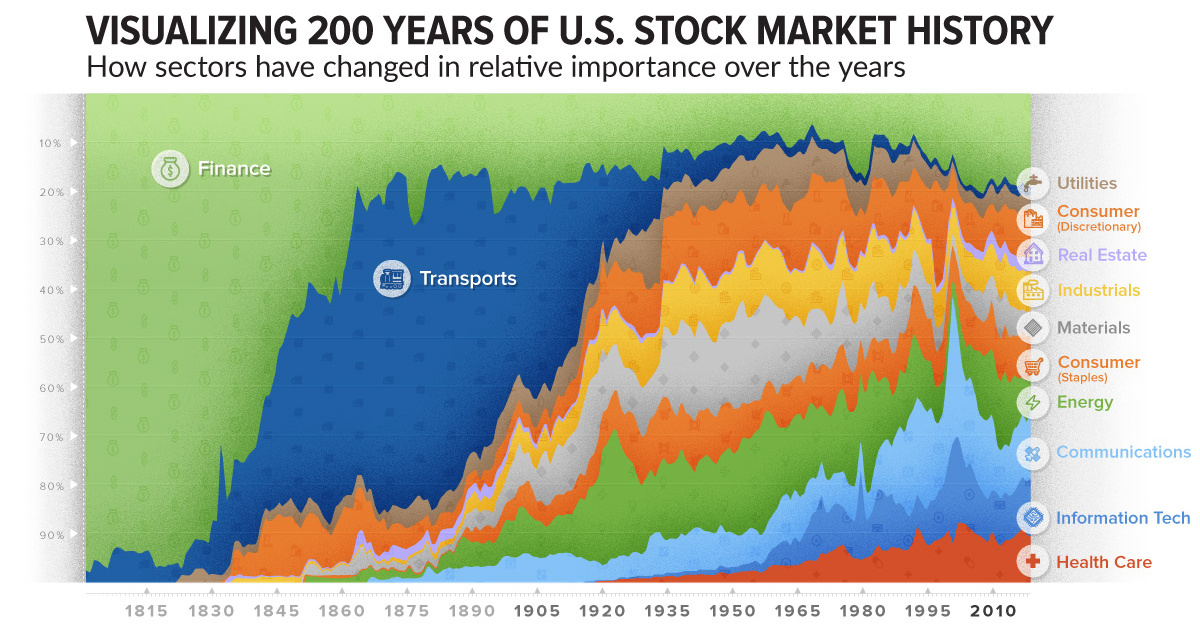
The valuations of all of those rail companies seem pretty absurd in hindsight, especially when looking at this week’s Chart of the Week on U.S. stock market history. It pulls numbers from Global Financial Data to contrast the relative sector weightings over 200 years.
While there are some obvious historical moments to be discovered on the chart, perhaps the most important lesson it demonstrates is the unpredictability of the market in general.
This is a reminder of why stock markets provide both risk and reward – as the speculators from 1869 found out, nobody knows for sure what the future holds.
How Sector Composition Has Changed
When stock market indices were introduced in the 1800s, only two types of equities were tracked: railroads and industrials.
Even by the year 1900, markets were much more complex – while railroads were still a dominant force, investors were starting to put money into other types of companies like utilities, steel, and energy companies.
Here’s a look at the share of market capitalization of the U.S. stock market in both 1900 and 2018:
| Sector | U.S. Stock Market (1900 share) | U.S. Stock Market (2018 share) |
|---|---|---|
| Finance | 20% | 19% |
| Transports | 38% | 2% |
| Utilities | 6% | 3% |
| Consumer Discretionary | 4% | 10% |
| Real Estate | 1% | 3% |
| Industrials | 5% | 8% |
| Materials | 8% | 5% |
| Consumer Staples | 5% | 8% |
| Energy | 8% | 7% |
| Communications | 5% | 14% |
| Information Tech | 0% | 12% |
| Health Care | 0% | 9% |
As of 2018, the market is more varied than it’s ever been.
Information tech, communications, and healthcare stocks, which did not really exist at the turn of the 20th century, are now many of America’s biggest companies. The transition is incredible to look at in retrospect, and makes us wonder what the market will look like 100 years from now.


Economy
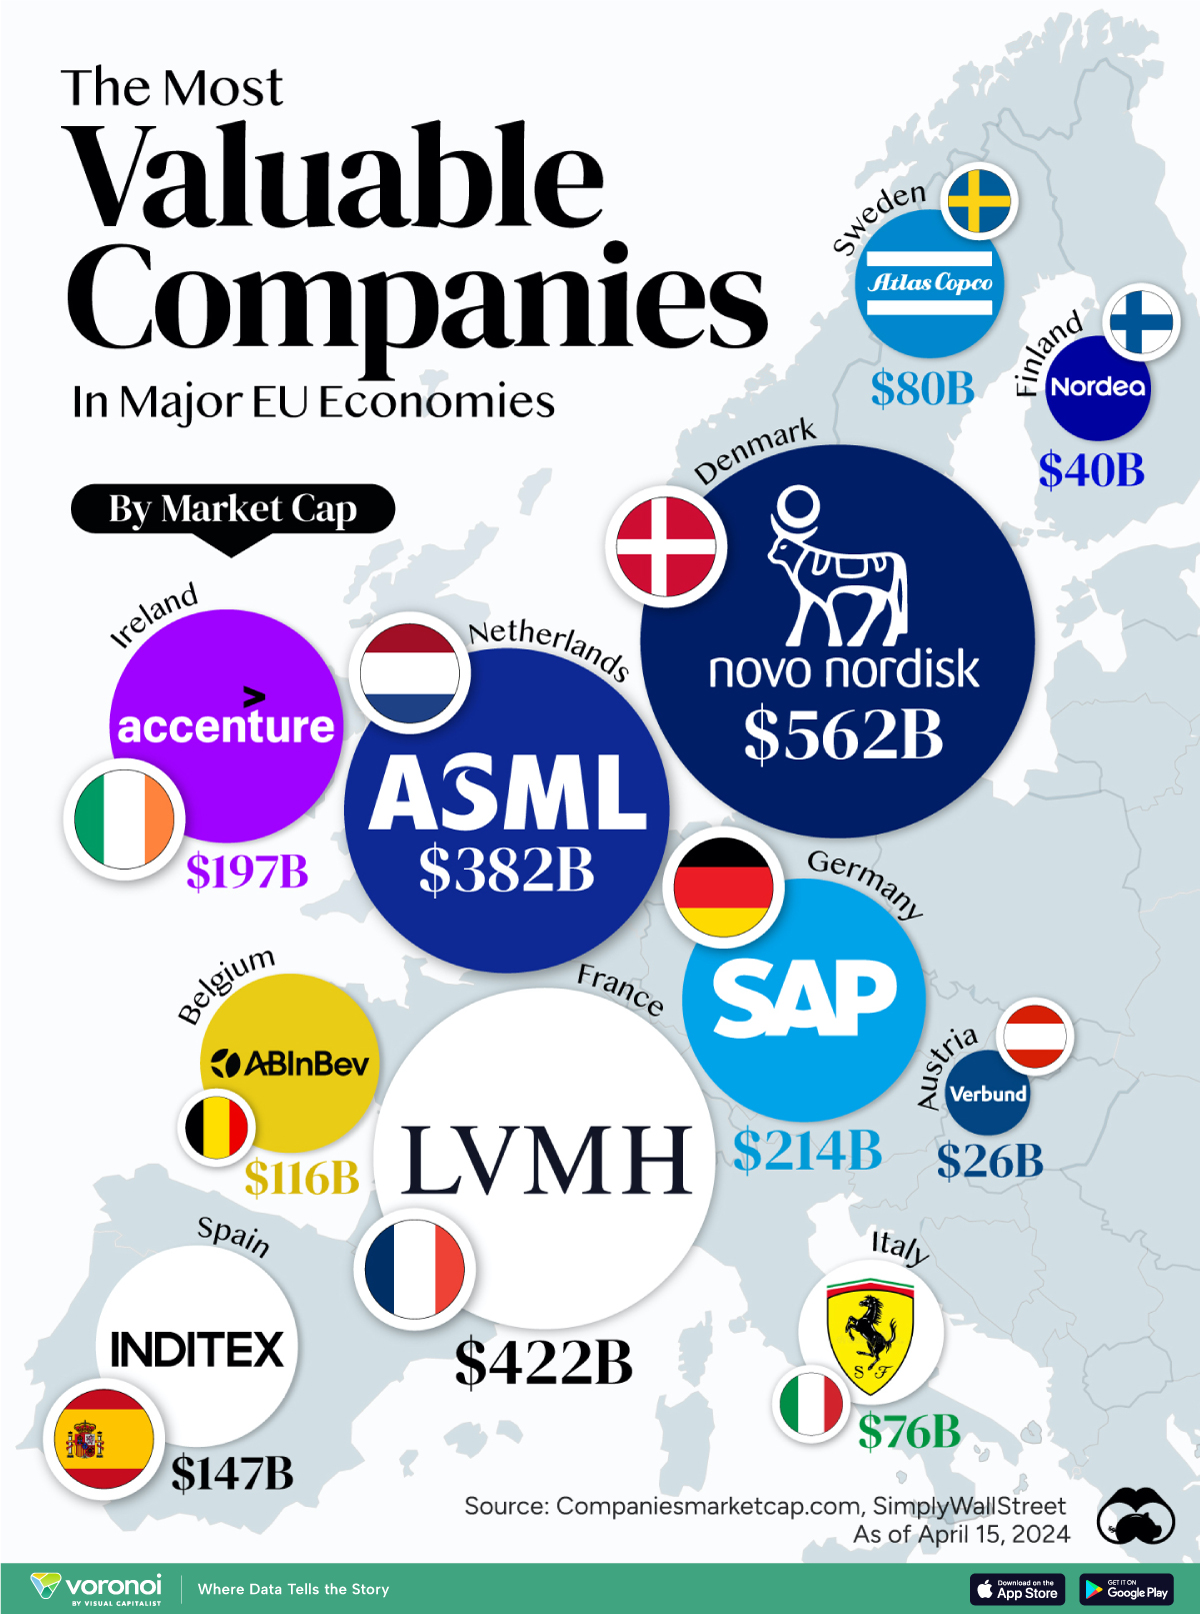
The Most Valuable Companies in Major EU Economies
From semiconductor equipment manufacturers to supercar makers, the EU’s most valuable companies run the gamut of industries.
Most Valuable Companies in the EU, by Country
This was originally posted on our Voronoi app. Download the app for free on iOS or Android and discover incredible data-driven charts from a variety of trusted sources.
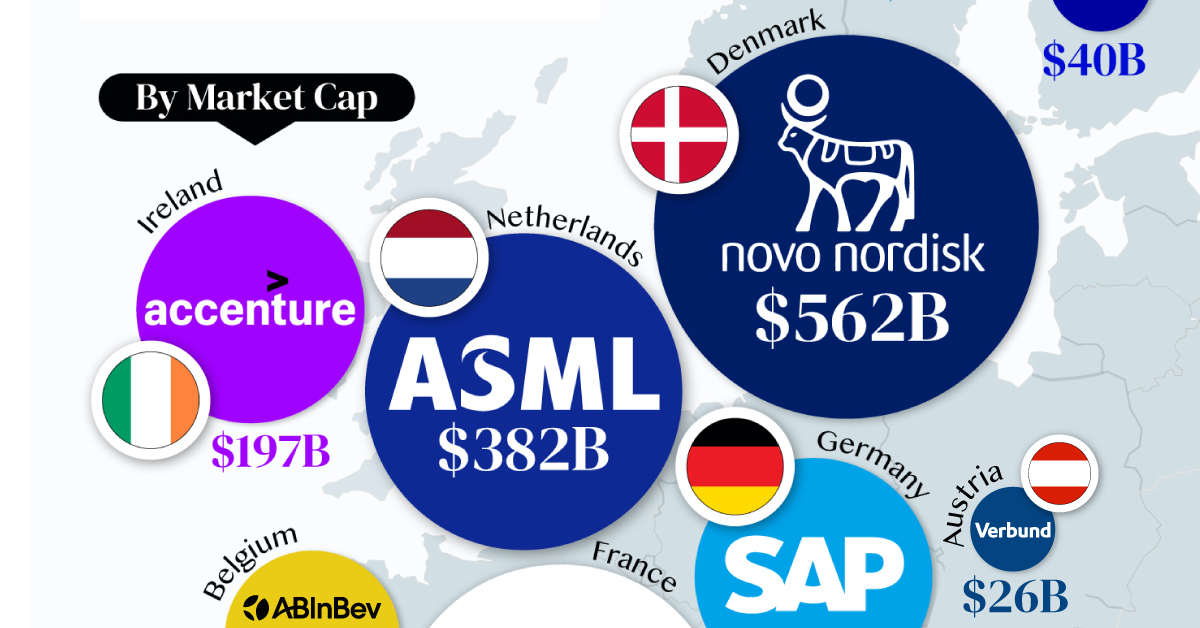
In this graphic, we mapped out the most valuable corporations in 11 major EU economies, based on their market capitalizations as of April 15th, 2024. All figures are in USD, and were sourced from Companiesmarketcap.com.
Novo Nordisk is currently worth more than $550 billion, making it Europe’s most valuable company by a wide margin. The pharmaceutical giant specializes in diabetes and weight-loss drugs. Demand for two of them, Ozempic and Wegovy, has surged due to their weight-loss capabilities, even causing nationwide shortages in the United States.
The following table includes an expanded list of the most valuable publicly-traded company in larger EU economies. Many of these were not included in the graphic due to space limitations.
| Country | Company | Sector | Market Cap |
|---|---|---|---|
| 🇩🇰 Denmark | 💊 Novo Nordisk | Pharmaceuticals | $562B |
| 🇫🇷 France | 👜 LVMH | Luxury Goods | $422B |
| 🇳🇱 Netherlands | 🔧 ASML | Semiconductor Equipment | $382B |
| 🇩🇪 Germany | 💼 SAP | Enterprise Software | $214B |
| 🇮🇪 Ireland | 🖥️ Accenture | IT Services | $197B |
| 🇪🇸 Spain | 👗 Inditex | Retail | $147B |
| 🇧🇪 Belgium | 🍻 Anheuser-Busch InBev | Beverages | $116B |
| 🇸🇪 Sweden | 🛠️ Atlas Copco | Industrial Equipment | $80B |
| 🇮🇹 Italy | 🏎️ Ferrari | Automotive | $76B |
| 🇫🇮 Finland | 🏦 Nordea Bank | Banking | $40B |
| 🇦🇹 Austria | 🔌 Verbund AG | Energy | $26B |
| 🇱🇺 Luxembourg | 🏗️ Tenaris | Oil & Gas Equipment | $22B |
| 🇨🇿 Czech Republic | 💡 CEZ Group | Energy | $20B |
| 🇵🇱 Poland | ⛽ PKN Orlen | Energy | $20B |
| 🇵🇹 Portugal | 🔌 EDP Group | Energy | $16B |
| 🇬🇷 Greece | 🏦 Eurobank | Banking | $7B |
| 🇭🇺 Hungary | ⛽ MOL Group | Energy | $7B |
| 🇭🇷 Croatia | 🏦 Zagrebacka Banka | Banking | $6B |
| 🇷🇴 Romania | ⛽ Romgaz | Energy | $4B |
| 🇸🇮 Slovenia | 💊 Krka | Pharmaceuticals | $4B |
Note: Figures are rounded and last updated on April 15th, 2024. Countries with top publicly-traded companies worth under $4 billion are excluded.
Luxury supergiant LVMH—which owns brands like Tiffany, Christian Dior, and TAG Heuer to name a few—is Europe’s second largest company by market cap, at $420 billion.
Rounding out the top three is ASML, which produces equipment crucial to chip manufacturers, worth $380 billion.
When looking at the region, there is a vast disparity between EU member states and their most valuable companies.
For example, as mentioned earlier, Denmark’s Novo Nordisk and France’s LVMH are worth between $400-550 billion each. Meanwhile, some countries don’t even have a single publicly-listed company that is worth over $1 billion.
In fact, only 12 EU countries (less than half of the union) are home to the top 100 most valuable companies within the bloc. An additional four countries are represented if you look at the list of the top 200 companies.

-

 Wealth6 days ago
Charted: Which City Has the Most Billionaires in 2024?
-

 Mining2 weeks ago
Gold vs. S&P 500: Which Has Grown More Over Five Years?
-

 Uranium2 weeks ago
The World’s Biggest Nuclear Energy Producers
-

 Education2 weeks ago
How Hard Is It to Get Into an Ivy League School?
-

 Debt2 weeks ago
How Debt-to-GDP Ratios Have Changed Since 2000
-

 Sports2 weeks ago
The Highest Earning Athletes in Seven Professional Sports
-

 Science2 weeks ago
Visualizing the Average Lifespans of Mammals
-

 Brands1 week ago
How Tech Logos Have Evolved Over Time