Markets
Walmart Nation: Mapping America’s Biggest Employers
Walmart Nation: Mapping America’s Biggest Employers
In America, approximately 150 million people are currently employed, doing everything from neurosurgery to greeting customers at your local Walmart Supercenter.
While there is a breathtaking variety of jobs out there, a few large-scale organizations stand out as the top employer in each state.
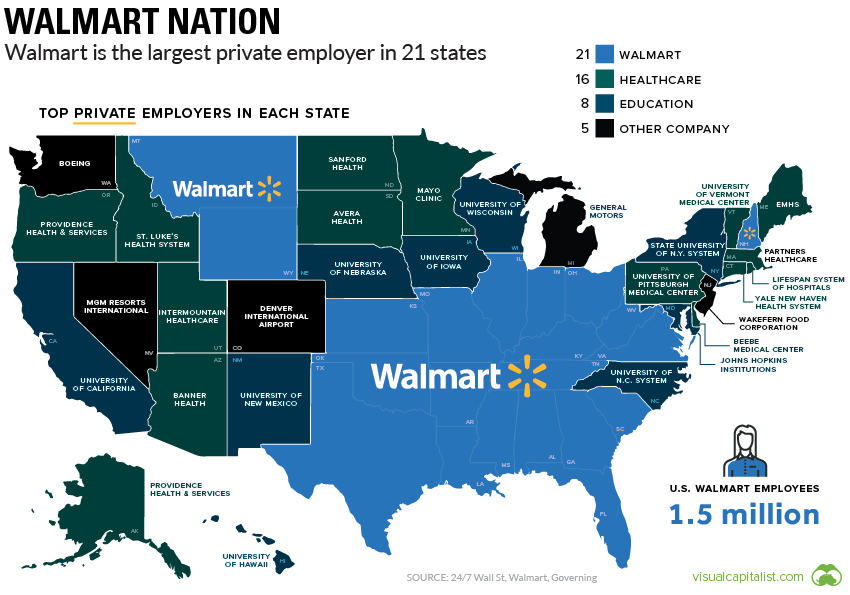
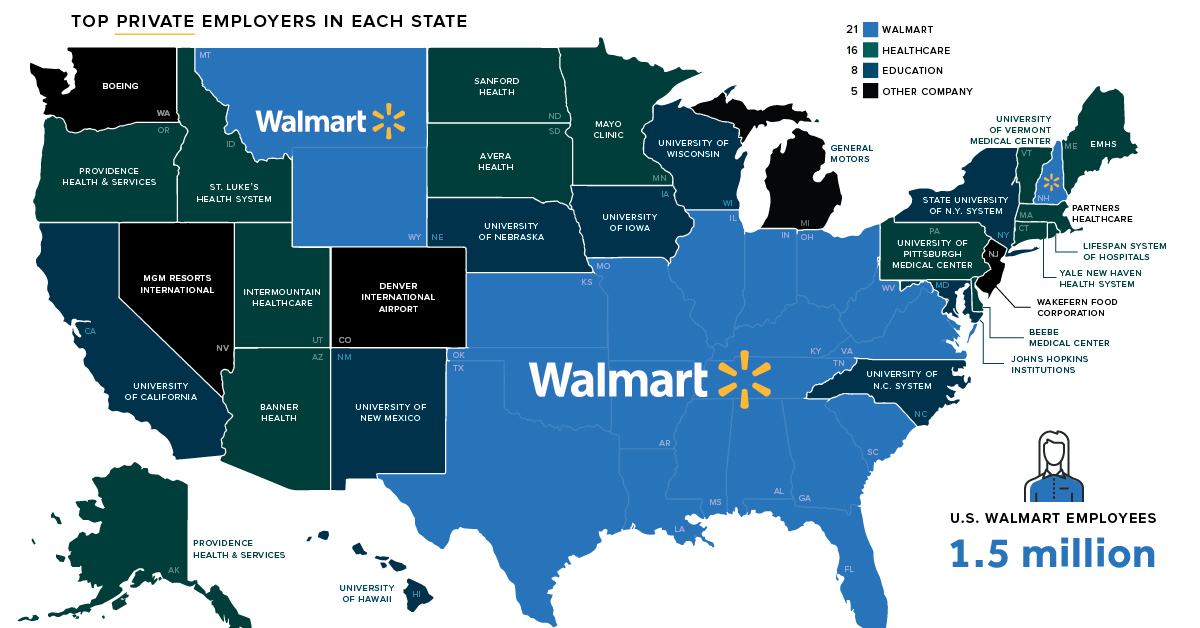
The Largest Employer in Each State
The U.S. is the third most populous country in the world, so it takes a lot of manpower to keep the government running. It’ll come as no surprise that, in most states, either the state or federal government is the top employer. California alone employs a quarter of a million federal workers.
New York State is a unique case as NYC’s municipal workforce is the top employer.
Technically, the largest employer on the planet is the U.S. Department of Defense, and in eight states, there are more active military personnel than any single private employer.
Non-Government Employers
When we exclude direct government and military employment, a few trends emerge. Universities and hospitals – there is often some overlap between the two – are top employers in nearly half of the states.
In a handful of cases, the top employer reflects an industry that is well known in the region. General Motors, for example, is still the top employer in Michigan. In Nevada? MGM Resorts International, with over 55,000 employees.
When it comes to large-scale employment, there’s one regional trend that stands out the most – the broad blue expanse of Walmart country.
View the high resolution version of today’s graphic by clicking here.
Walmart Nation
Walmart is the biggest company in the world by revenue, and there are over 3,500 Walmart Supercenters spread around the United States alone. It takes about 1% of private sector workforce in the United States to keep this massive fleet of big box stores running. In Arkansas, that figure jumps up to 4%, with about one-third of the total retail workforce employed at the retail giant.
Here’s a full look at the 21 states where Walmart is the top employer.
| State | # of Walmart Employees |
|---|---|
| Texas | 168,403 |
| Florida | 107,460 |
| Georgia | 60,002 |
| Illinois | 53,687 |
| Arkansas | 52,367 |
| Ohio | 50,186 |
| Virginia | 43,623 |
| Missouri | 42,029 |
| Tennessee | 40,598 |
| Indiana | 39,875 |
| Alabama | 37,207 |
| Louisiana | 36,309 |
| Oklahoma | 32,713 |
| South Carolina | 32,165 |
| Kentucky | 29,554 |
| Mississippi | 24,180 |
| Kansas | 20,103 |
| West Virginia | 11,864 |
| New Hampshire | 7,593 |
| Montana | 4,861 |
| Wyoming | 4,648 |
What About Amazon?
When we talk about the retail industry, it’s impossible to avoid discussing Amazon. The e-commerce company is growing at an impressive clip, and is now the second largest private employer in the country, with over half a million employees.
That said, even with the acquisition of Whole Foods, Amazon still has a long way to go to catch up to Walmart’s massive employee count. The company’s reliance on contract workers and supply chain automation means that this map is unlikely to turn orange in the near future.


Markets
The European Stock Market: Attractive Valuations Offer Opportunities
On average, the European stock market has valuations that are nearly 50% lower than U.S. valuations. But how can you access the market?


European Stock Market: Attractive Valuations Offer Opportunities
Europe is known for some established brands, from L’Oréal to Louis Vuitton. However, the European stock market offers additional opportunities that may be lesser known.
The above infographic, sponsored by STOXX, outlines why investors may want to consider European stocks.
Attractive Valuations
Compared to most North American and Asian markets, European stocks offer lower or comparable valuations.
| Index | Price-to-Earnings Ratio | Price-to-Book Ratio |
|---|---|---|
| EURO STOXX 50 | 14.9 | 2.2 |
| STOXX Europe 600 | 14.4 | 2 |
| U.S. | 25.9 | 4.7 |
| Canada | 16.1 | 1.8 |
| Japan | 15.4 | 1.6 |
| Asia Pacific ex. China | 17.1 | 1.8 |
Data as of February 29, 2024. See graphic for full index names. Ratios based on trailing 12 month financials. The price to earnings ratio excludes companies with negative earnings.
On average, European valuations are nearly 50% lower than U.S. valuations, potentially offering an affordable entry point for investors.
Research also shows that lower price ratios have historically led to higher long-term returns.
Market Movements Not Closely Connected
Over the last decade, the European stock market had low-to-moderate correlation with North American and Asian equities.
The below chart shows correlations from February 2014 to February 2024. A value closer to zero indicates low correlation, while a value of one would indicate that two regions are moving in perfect unison.
| EURO STOXX 50 | STOXX EUROPE 600 | U.S. | Canada | Japan | Asia Pacific ex. China |
|
|---|---|---|---|---|---|---|
| EURO STOXX 50 | 1.00 | 0.97 | 0.55 | 0.67 | 0.24 | 0.43 |
| STOXX EUROPE 600 | 1.00 | 0.56 | 0.71 | 0.28 | 0.48 | |
| U.S. | 1.00 | 0.73 | 0.12 | 0.25 | ||
| Canada | 1.00 | 0.22 | 0.40 | |||
| Japan | 1.00 | 0.88 | ||||
| Asia Pacific ex. China | 1.00 |
Data is based on daily USD returns.
European equities had relatively independent market movements from North American and Asian markets. One contributing factor could be the differing sector weights in each market. For instance, technology makes up a quarter of the U.S. market, but health care and industrials dominate the broader European market.
Ultimately, European equities can enhance portfolio diversification and have the potential to mitigate risk for investors.
Tracking the Market
For investors interested in European equities, STOXX offers a variety of flagship indices:
| Index | Description | Market Cap |
|---|---|---|
| STOXX Europe 600 | Pan-regional, broad market | €10.5T |
| STOXX Developed Europe | Pan-regional, broad-market | €9.9T |
| STOXX Europe 600 ESG-X | Pan-regional, broad market, sustainability focus | €9.7T |
| STOXX Europe 50 | Pan-regional, blue-chip | €5.1T |
| EURO STOXX 50 | Eurozone, blue-chip | €3.5T |
Data is as of February 29, 2024. Market cap is free float, which represents the shares that are readily available for public trading on stock exchanges.
The EURO STOXX 50 tracks the Eurozone’s biggest and most traded companies. It also underlies one of the world’s largest ranges of ETFs and mutual funds. As of November 2023, there were €27.3 billion in ETFs and €23.5B in mutual fund assets under management tracking the index.
“For the past 25 years, the EURO STOXX 50 has served as an accurate, reliable and tradable representation of the Eurozone equity market.”
— Axel Lomholt, General Manager at STOXX
Partnering with STOXX to Track the European Stock Market
Are you interested in European equities? STOXX can be a valuable partner:
- Comprehensive, liquid and investable ecosystem
- European heritage, global reach
- Highly sophisticated customization capabilities
- Open architecture approach to using data
- Close partnerships with clients
- Part of ISS STOXX and Deutsche Börse Group
With a full suite of indices, STOXX can help you benchmark against the European stock market.
Learn how STOXX’s European indices offer liquid and effective market access.

-

 Economy2 days ago
Economic Growth Forecasts for G7 and BRICS Countries in 2024
The IMF has released its economic growth forecasts for 2024. How do the G7 and BRICS countries compare?
-

 Markets1 week ago
U.S. Debt Interest Payments Reach $1 Trillion
U.S. debt interest payments have surged past the $1 trillion dollar mark, amid high interest rates and an ever-expanding debt burden.
-

 United States2 weeks ago
Ranked: The Largest U.S. Corporations by Number of Employees
We visualized the top U.S. companies by employees, revealing the massive scale of retailers like Walmart, Target, and Home Depot.
-

 Markets2 weeks ago
The Top 10 States by Real GDP Growth in 2023
This graphic shows the states with the highest real GDP growth rate in 2023, largely propelled by the oil and gas boom.
-

 Markets2 weeks ago
Ranked: The World’s Top Flight Routes, by Revenue
In this graphic, we show the highest earning flight routes globally as air travel continued to rebound in 2023.
-

 Markets2 weeks ago
Ranked: The Most Valuable Housing Markets in America
The U.S. residential real estate market is worth a staggering $47.5 trillion. Here are the most valuable housing markets in the country.


-

 Education1 week ago
How Hard Is It to Get Into an Ivy League School?
-

 Technology2 weeks ago
Ranked: Semiconductor Companies by Industry Revenue Share
-
Markets2 weeks ago
Ranked: The World’s Top Flight Routes, by Revenue
-

 Demographics2 weeks ago
Population Projections: The World’s 6 Largest Countries in 2075
-
Markets2 weeks ago
The Top 10 States by Real GDP Growth in 2023
-

 Demographics2 weeks ago
The Smallest Gender Wage Gaps in OECD Countries
-

 Economy2 weeks ago
Where U.S. Inflation Hit the Hardest in March 2024
-

 Environment2 weeks ago
Top Countries By Forest Growth Since 2001