Automotive
14 Defunct Car Brands, and How They Failed
Automobile enthusiasts around the world know brands like Studebaker, Plymouth and Packard, but you’d be hard-pressed to find any of these on the roads today. Former powerhouses in the American auto market – they have since become beloved by collectors, but lost to the general public.
Today’s infographic comes from TitleMax and it looks at 14 now-defunct car brands and the circumstances that took them from highways to bygones.
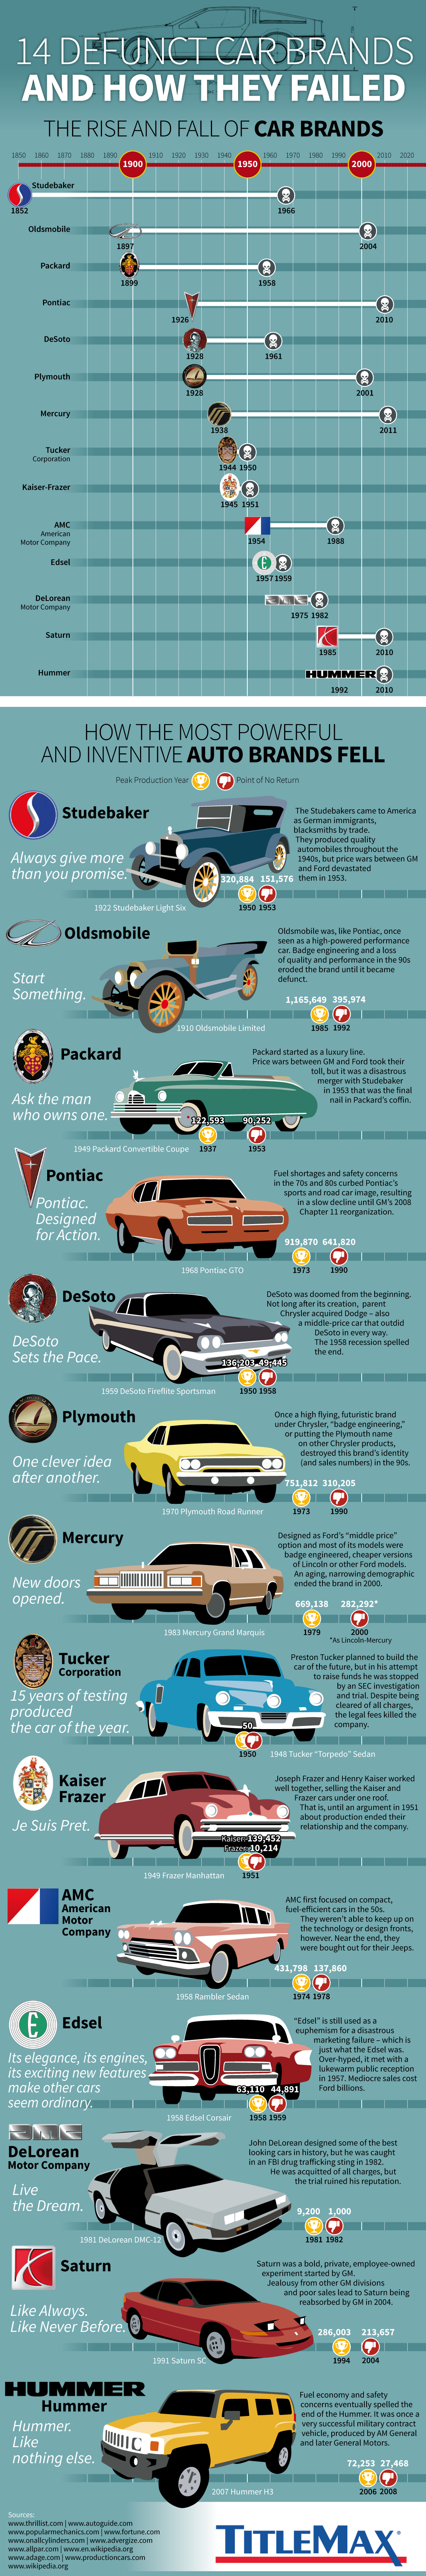
These are only a selection of a much longer list of car brands that have not survived to see the present day. What accounts for the churn rate of these brands?
Bold Experiments, Boondoggles, and Burnouts
Some car brands, like Tucker and Saturn, introduced new ideas that the market simply didn’t care for, didn’t perform as well as the competition, or were too ambitious for the industry climate.
Others, like Edsel and DeLorean, met swift ends as they hemorrhaged money far faster than their owners anticipated. Even more brands were simply folded into the ever-expanding portfolios of either Ford or General Motors, the two biggest auto conglomerates ever to rule the roads.
Bad Timing, or Worse Economy?
Car sales rise and fall with broader economic trends because they are tied into so many different variables: raw materials, production costs, labor costs, oil prices, and interest rates among others.
We can look at two time periods in which the combination of these conditions caused many of the brands on this list to fail.
Post-war Doldrums (1950-1958)
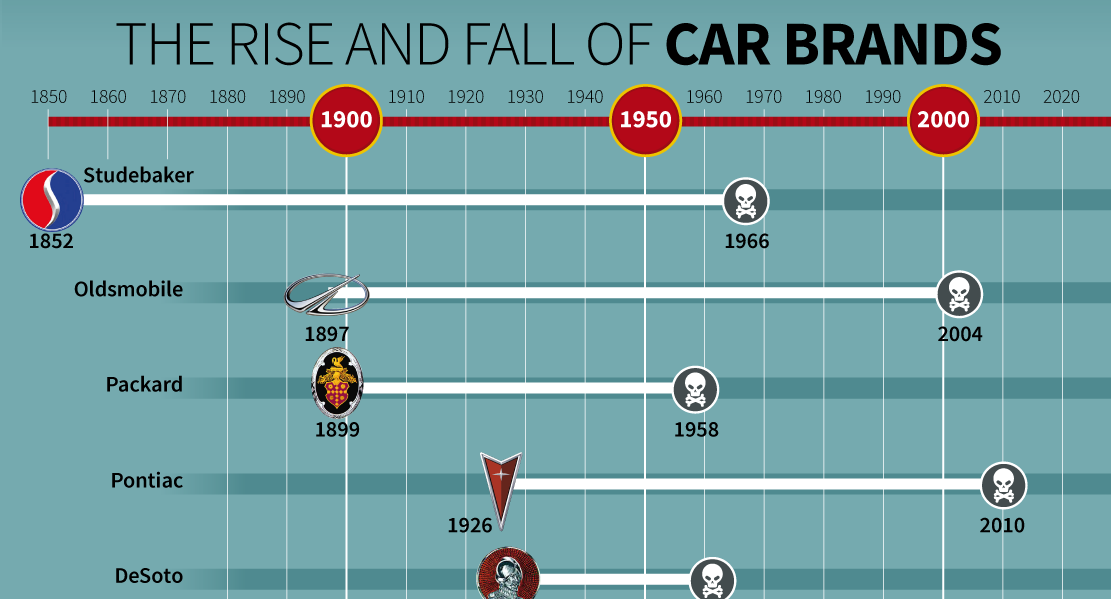
Based on the timeline above, we can see that 1950s were a terrible time for the smaller players in the auto industry. The explanation as to why so many brands declined over this decade has to do with the highly competitive, oligopolistic business practices of market leaders Ford and General Motors. Both of these market titans were locked in a battle to lower prices by taking advantage of economies of scale, while wooing customers who were feeling the economic pressures of a postwar recession.
Smaller volume manufacturers like Packard and Studebaker could not keep up, even when they attempted to merge. As a result, these and many other smaller brands were forced out, or absorbed into the portfolios of one of the “big two.”
Same Car, Different Name (1998-2008)
A similar stretch of declining sales plagued the late 1990s and early 2000s, as the trend of “badge engineering” caught up with manufacturers.
Rather than designing new models at high cost, conglomerates like GM simply engineered new brand “badges” and marketed the same basic models under a variety of names like Pontiac, Plymouth, Mercury, or Oldsmobile. The same tactic was later used to take mid-market designs, such as the Ford Fusion, and style them for a luxury audience as a new model – in this case, the Lincoln Mk. Z.
Badge engineering curbed the appeal of a number of American brands under the GM and Ford portfolios. The nail in many of their coffins was the major auto industry downturn in 2008. That year, GM restructured as it underwent Chapter 11 bankruptcy.
As a result, GM removed the majority of its badge engineered brands, including many of those listed above, from dealerships in the following years.


Lithium
Ranked: The Top 10 EV Battery Manufacturers in 2023
Asia dominates this ranking of the world’s largest EV battery manufacturers in 2023.


The Top 10 EV Battery Manufacturers in 2023
This was originally posted on our Voronoi app. Download the app for free on iOS or Android and discover incredible data-driven charts from a variety of trusted sources.
Despite efforts from the U.S. and EU to secure local domestic supply, all major EV battery manufacturers remain based in Asia.
In this graphic we rank the top 10 EV battery manufacturers by total battery deployment (measured in megawatt-hours) in 2023. The data is from EV Volumes.
Chinese Dominance
Contemporary Amperex Technology Co. Limited (CATL) has swiftly risen in less than a decade to claim the title of the largest global battery group.
The Chinese company now has a 34% share of the market and supplies batteries to a range of made-in-China vehicles, including the Tesla Model Y, SAIC’s MG4/Mulan, and various Li Auto models.
| Company | Country | 2023 Production (megawatt-hour) | Share of Total Production |
|---|---|---|---|
| CATL | 🇨🇳 China | 242,700 | 34% |
| BYD | 🇨🇳 China | 115,917 | 16% |
| LG Energy Solution | 🇰🇷 Korea | 108,487 | 15% |
| Panasonic | 🇯🇵 Japan | 56,560 | 8% |
| SK On | 🇰🇷 Korea | 40,711 | 6% |
| Samsung SDI | 🇰🇷 Korea | 35,703 | 5% |
| CALB | 🇨🇳 China | 23,493 | 3% |
| Farasis Energy | 🇨🇳 China | 16,527 | 2% |
| Envision AESC | 🇨🇳 China | 8,342 | 1% |
| Sunwoda | 🇨🇳 China | 6,979 | 1% |
| Other | - | 56,040 | 8% |
In 2023, BYD surpassed LG Energy Solution to claim second place. This was driven by demand from its own models and growth in third-party deals, including providing batteries for the made-in-Germany Tesla Model Y, Toyota bZ3, Changan UNI-V, Venucia V-Online, as well as several Haval and FAW models.
The top three battery makers (CATL, BYD, LG) collectively account for two-thirds (66%) of total battery deployment.
Once a leader in the EV battery business, Panasonic now holds the fourth position with an 8% market share, down from 9% last year. With its main client, Tesla, now sourcing batteries from multiple suppliers, the Japanese battery maker seems to be losing its competitive edge in the industry.
Overall, the global EV battery market size is projected to grow from $49 billion in 2022 to $98 billion by 2029, according to Fortune Business Insights.

-

 Brands6 days ago
How Tech Logos Have Evolved Over Time
-

 Demographics2 weeks ago
The Smallest Gender Wage Gaps in OECD Countries
-

 Economy2 weeks ago
Where U.S. Inflation Hit the Hardest in March 2024
-

 Green2 weeks ago
Top Countries By Forest Growth Since 2001
-

 United States2 weeks ago
Ranked: The Largest U.S. Corporations by Number of Employees
-

 Maps2 weeks ago
The Largest Earthquakes in the New York Area (1970-2024)
-

 Green2 weeks ago
Ranked: The Countries With the Most Air Pollution in 2023
-

 Green2 weeks ago
Ranking the Top 15 Countries by Carbon Tax Revenue