Don’t leave before you’ve caught up on all the daily data drops from AI Week.
Visualizing AI vs. Human Performance in Technical Tasks
The Ultimate Visual Breakdown of the AI Index Report 2025 (VC+)
Charted: The Surging Cost of Training AI Models
Ranked: All the Things People Use AI for in 2025
Charted: Countries Accumulating the Most AI Patents
Ranked: Top Countries by Stock Market Returns Since 2015
Ranked: America’s Smartest CEOs According to Linguistic Analysis
Timeline: Visualizing America’s Oldest Companies
Charted: The S&P 500’s Trump-Driven Tariff Turbulence
Chart: The Average U.S. Tariff Rate (1890-2025)
Charted: Where the U.S. Imports Its Art From
U.S. Latino GDP vs. Global Economic Powers
Mapped: Daycare Costs by State
Ranked: The Top 10 U.S. States by Auto Manufacturing Jobs
Charted: Corporate Bankruptcies in the U.S. (2010–2024)
Mapped: Financial Literacy Levels in All 50 U.S. States
Charted: How Much Income Tax Americans Pay by Wealth Bracket
Ranked: States Where Americans Have the Most Cash in the Bank
Ranked: Favorite Car Brands of the Ultra-Rich
How Much Does Each U.S. Wealth Bracket Pay in Income Taxes?
Mapped: Countries Where People Don’t Exercise Enough
How U.S. Medicare Prices Compare to Other Rich Nations
Charted: How American Life Expectancy Compares to Its Peers
Mapped: Europe’s Tobacco Use By Country
Charted: Cigarette Smoking’s Decline in U.S. Young Adults
Charted: Battery Capacity by Country (2024-2030)
Charted: How Top Economies Generated Electricity in 2024
How the Largest Importers of Russian Fossil Fuels Have Changed (2022 vs. 2025)
Top 20 Countries by Battery Storage Capacity
Charted: Renewable Energy Capacity in the U.S. (2014-2024)
Mapped: Most Air-Polluted Cities in the World
Mapped: Billionaires by Country of Citizenship in 2025
Mapped: The Most Taxed States in America
Charted: The End-of-Life Recycling Rates of Select Metals
Mapped: Ukraine’s Mineral Resources
How Rich is Canada in Natural Resources?
Charted: Top Suppliers of Aluminum and Steel to the U.S.
How Much Gold Exists for Every Person on Earth?
Infographic: How Long Does Plastic Take to Decompose?
A Visual Breakdown of Global Waste by Type
Ranked: Companies with the Most Fossil Fuel and Cement CO2 Emissions
Charted: Share of Freshwater Resources by Country
Writer for Visual Capitalist and Grayowl Point. Lives in Vancouver. Cyclist, internet denizen, roleplayer.
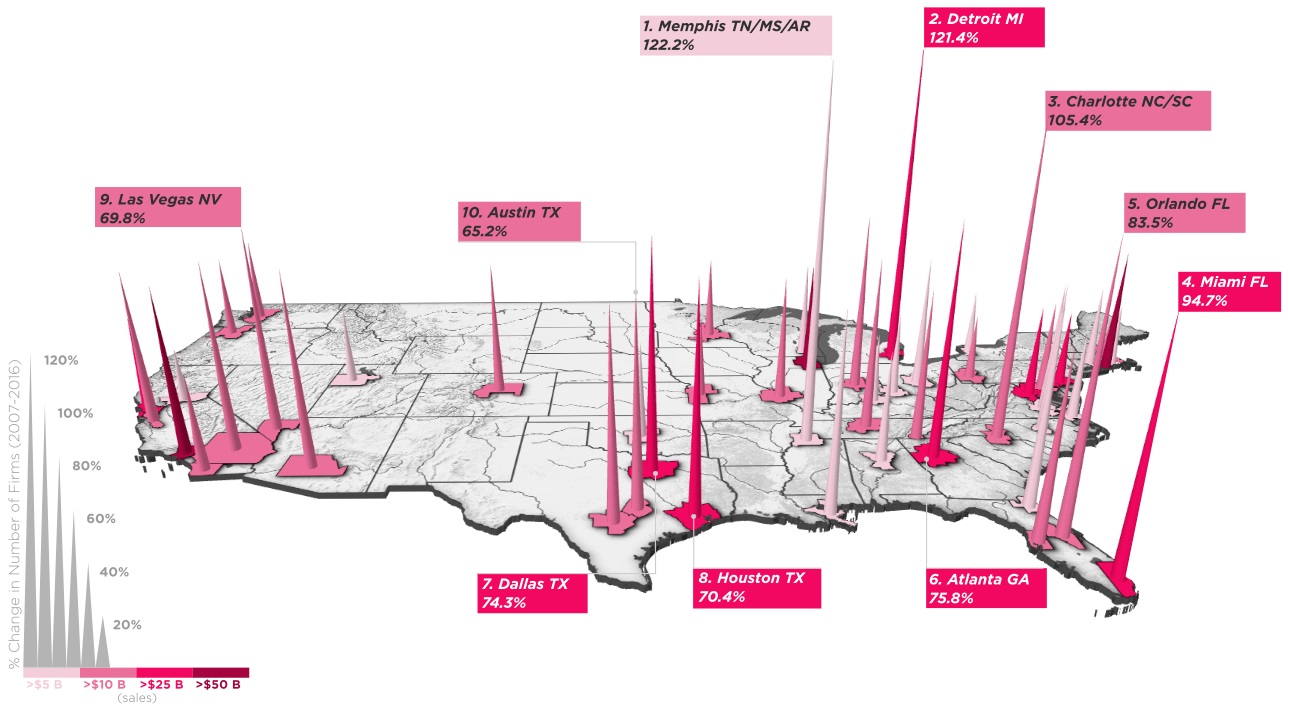
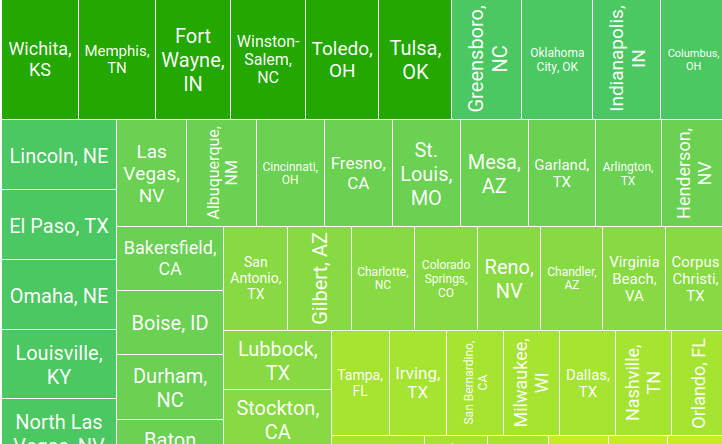
Women-owned businesses make up an increasing percentage of the American economy. Here are some of the cities where these businesses are being added the fastest.
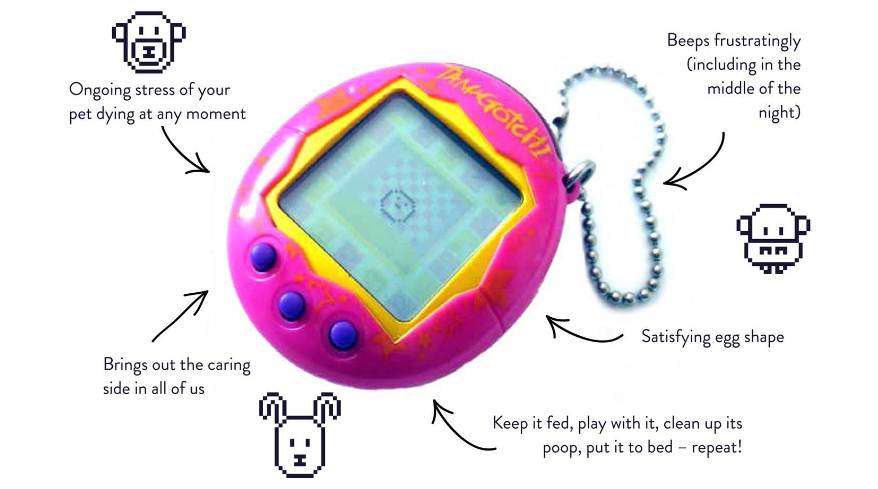
The eighties and nineties may seem like ancient history for tech, but the DNA of decades-old innovations is still running through modern technology.
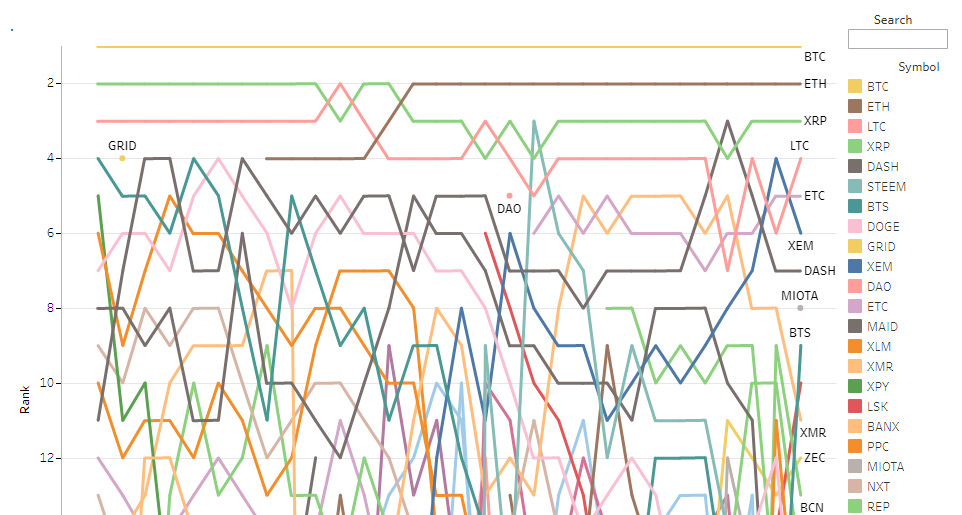
The coin universe is fast-moving and sometimes chaotic. See how the list of the top 20 cryptocurrencies has changed over the last 2.5 years.
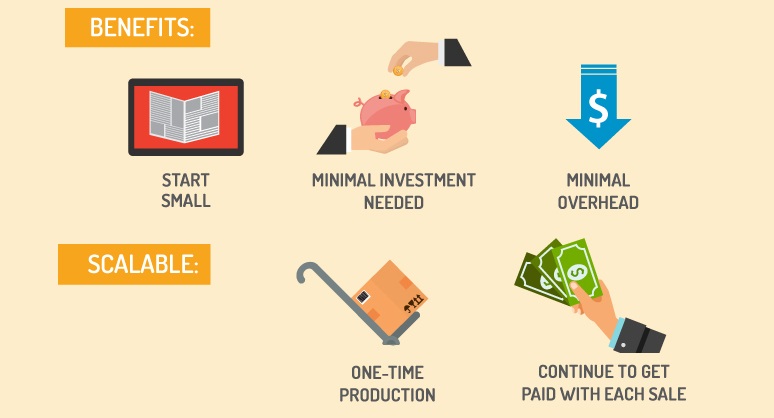
The internet is the modern entrepreneurial petri dish from which great ideas come to life. Here are 5 ways to make the leap and start a...
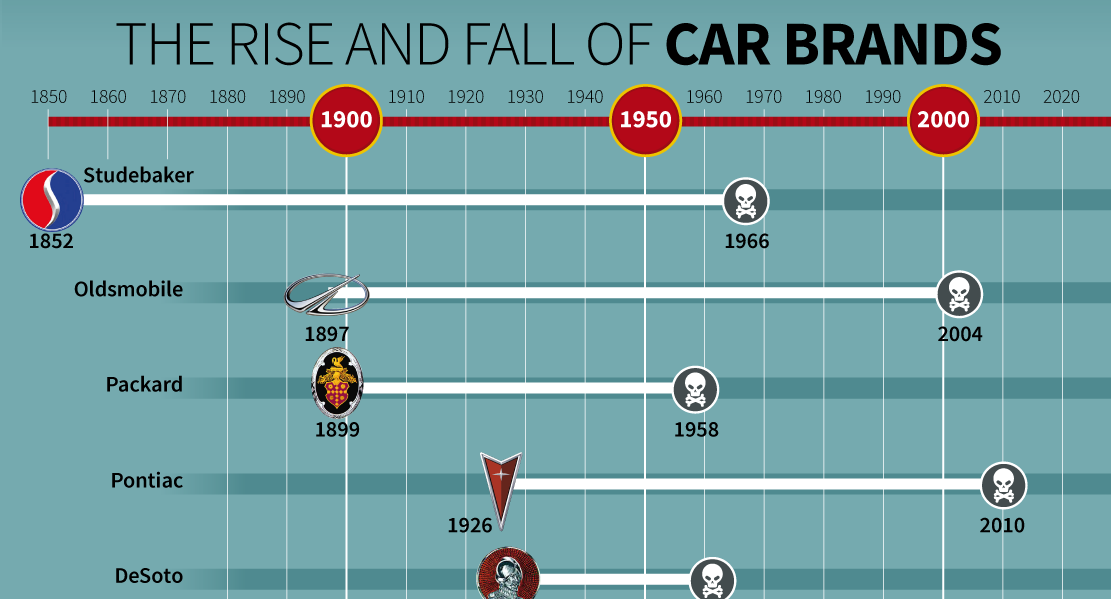
You'd be hard-pressed to find any of these 14 iconic car brands on the roads today. Here's how these brands failed, and why.
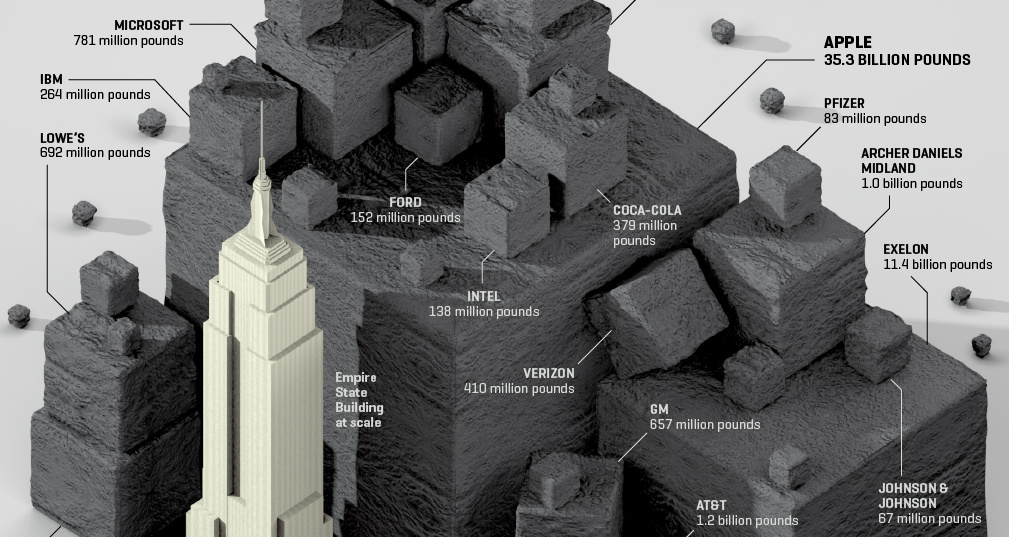
Visualizing the CO2 emissions saved by 56 of the Fortune 100 companies, expressed using the quantity of coal not burned.
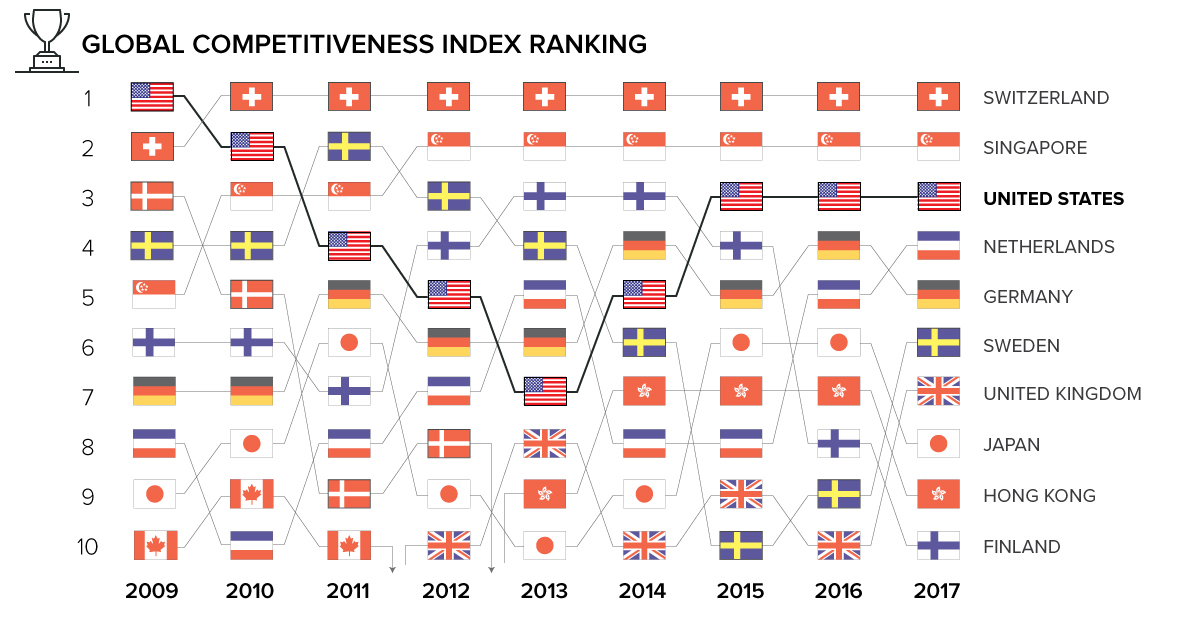
What makes a country competitive on the world stage? Today's animation and interactive charts show global competitiveness over time, and how it's measured.
With rental prices rising sharply across the U.S., these interactive graphics show the trade-off between the cost and size in the 100 largest metro areas.
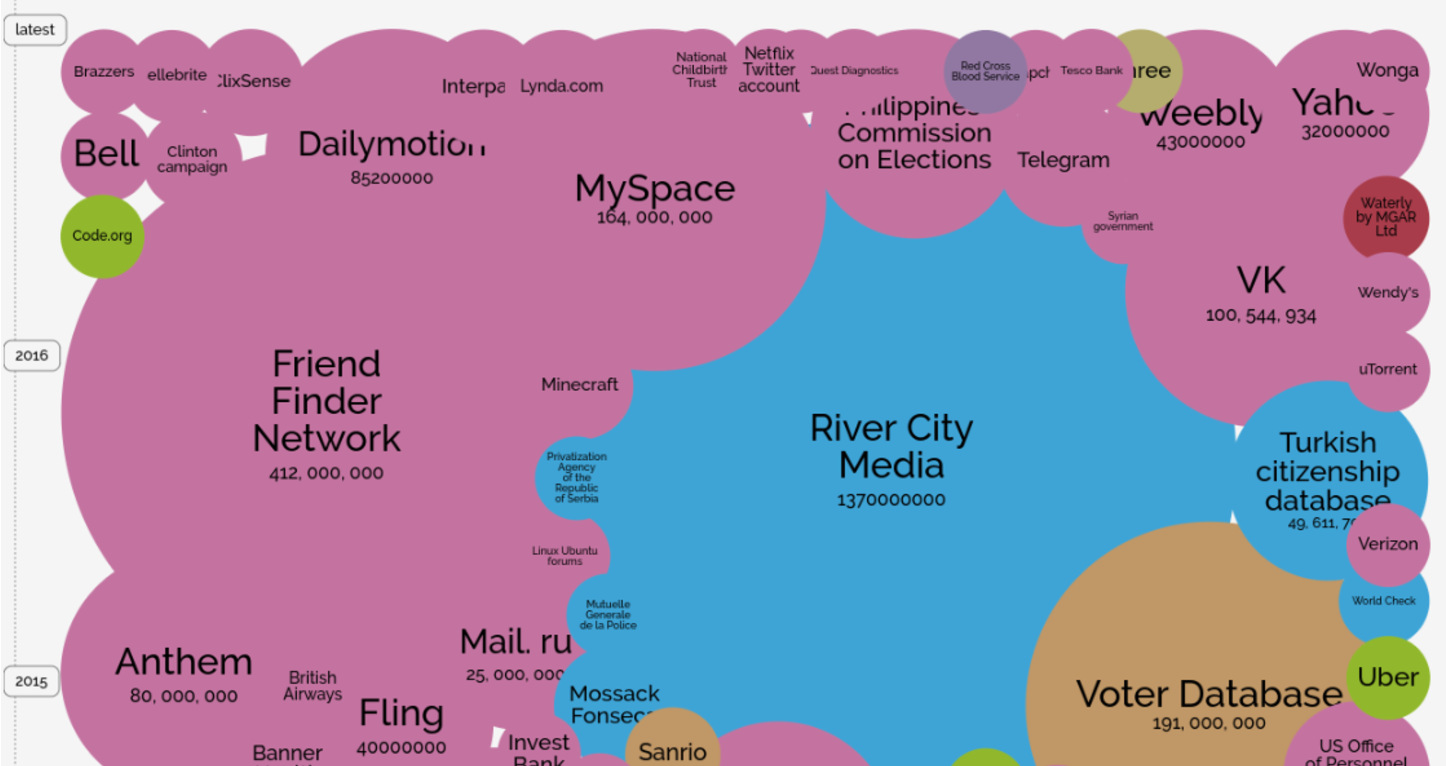
Hacking has become more frequent and more serious. Explore the biggest data breaches in history in this data visualization.
The chicken and egg problem faced by electric vehicles is not unlike an issue solved by Henry Ford and the Model T a century earlier.
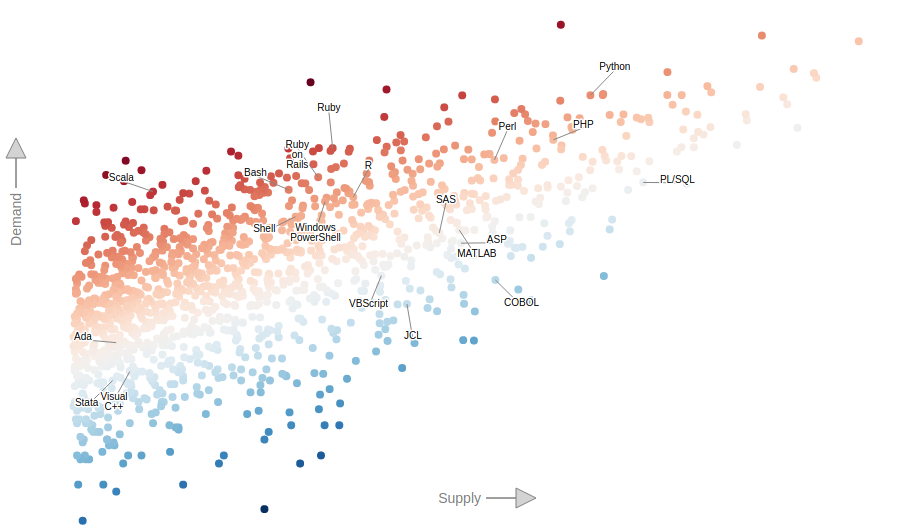
The interactive graphic helps us to visualize the relationship between the supply and demand for over 1,400 technology skills.
The most popular books throughout history are all connected by their ability to get people to debate and discuss. A little controversy can go a long...