Misc
Sentiment Scale Reveals Which Words Pack the Most Punch
For world leaders, journalists, CEOs, or anyone who has ever had to explain a dicey report card, word selection can have an enormous impact on how a message is perceived.
Does it make any difference whether a presentation went quite good versus pretty good, or if an earnings report is described as awful versus poor? According to a new survey from YouGov, word sentiment isn’t as cut-and-dry as one would expect.
The United States of Sentiment
Certain words more precisely communicate positive and negative feelings.
Interestingly, very bad edges out words like abysmal and dreadful as the most conclusively negative phrase for those survey respondents based in the United States.
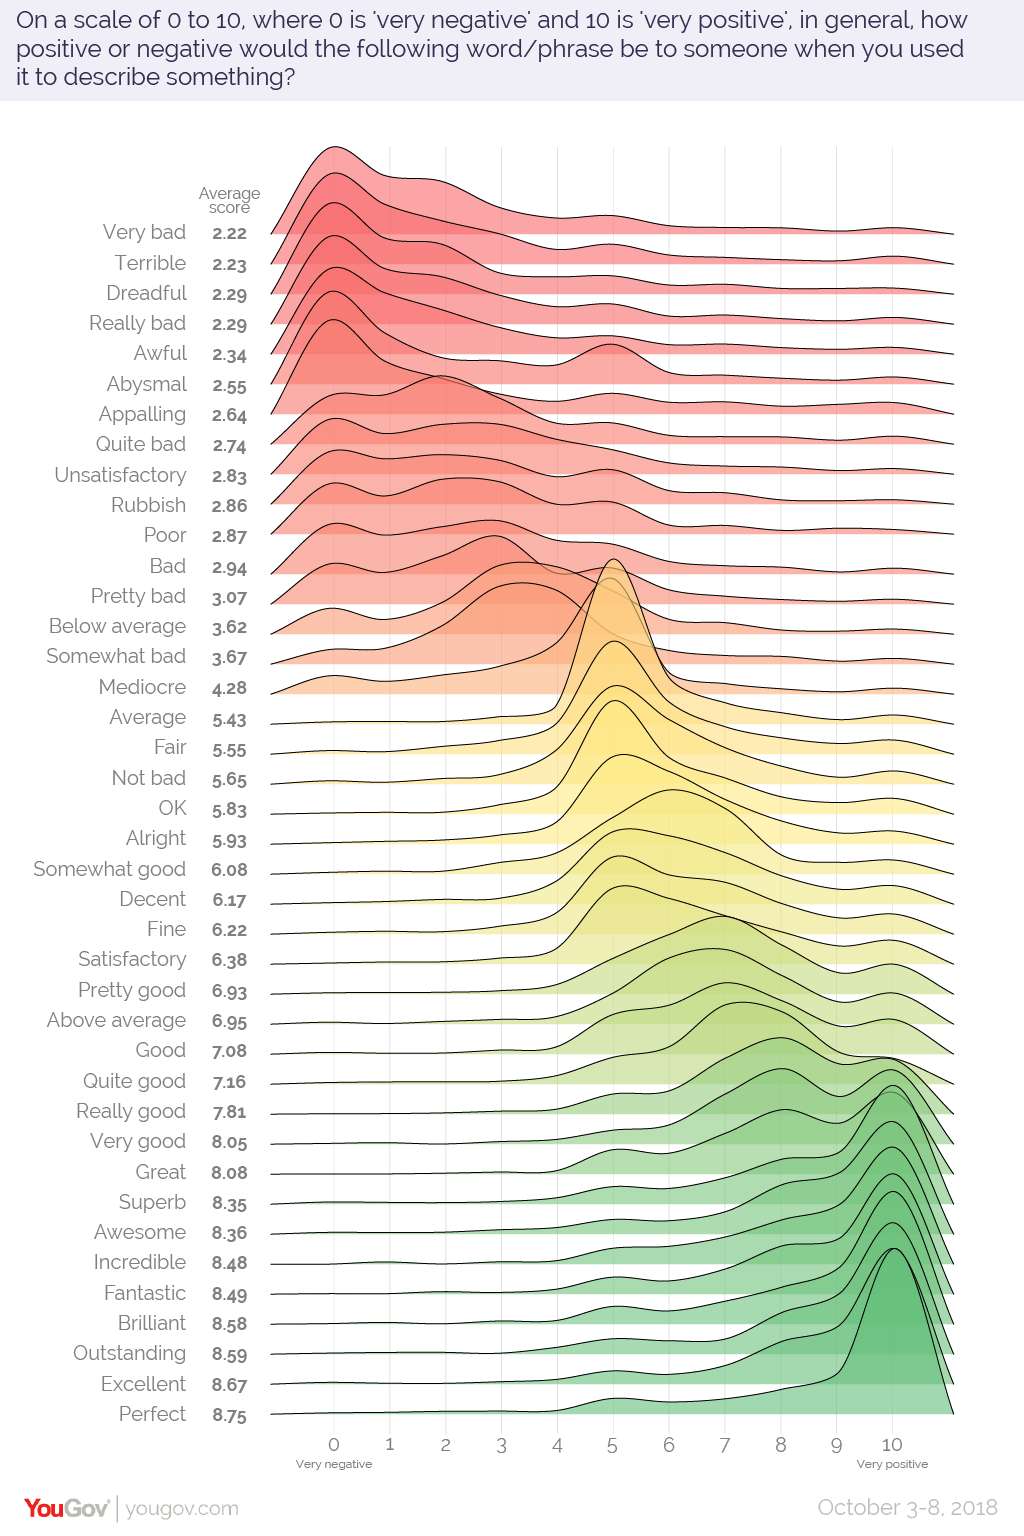
On the positive end of the spectrum, perfect was most conclusively positive term.
Effective Words: U.K. Edition
The version of the survey conducted in the United Kingdom reveals interesting differences in how words are perceived.
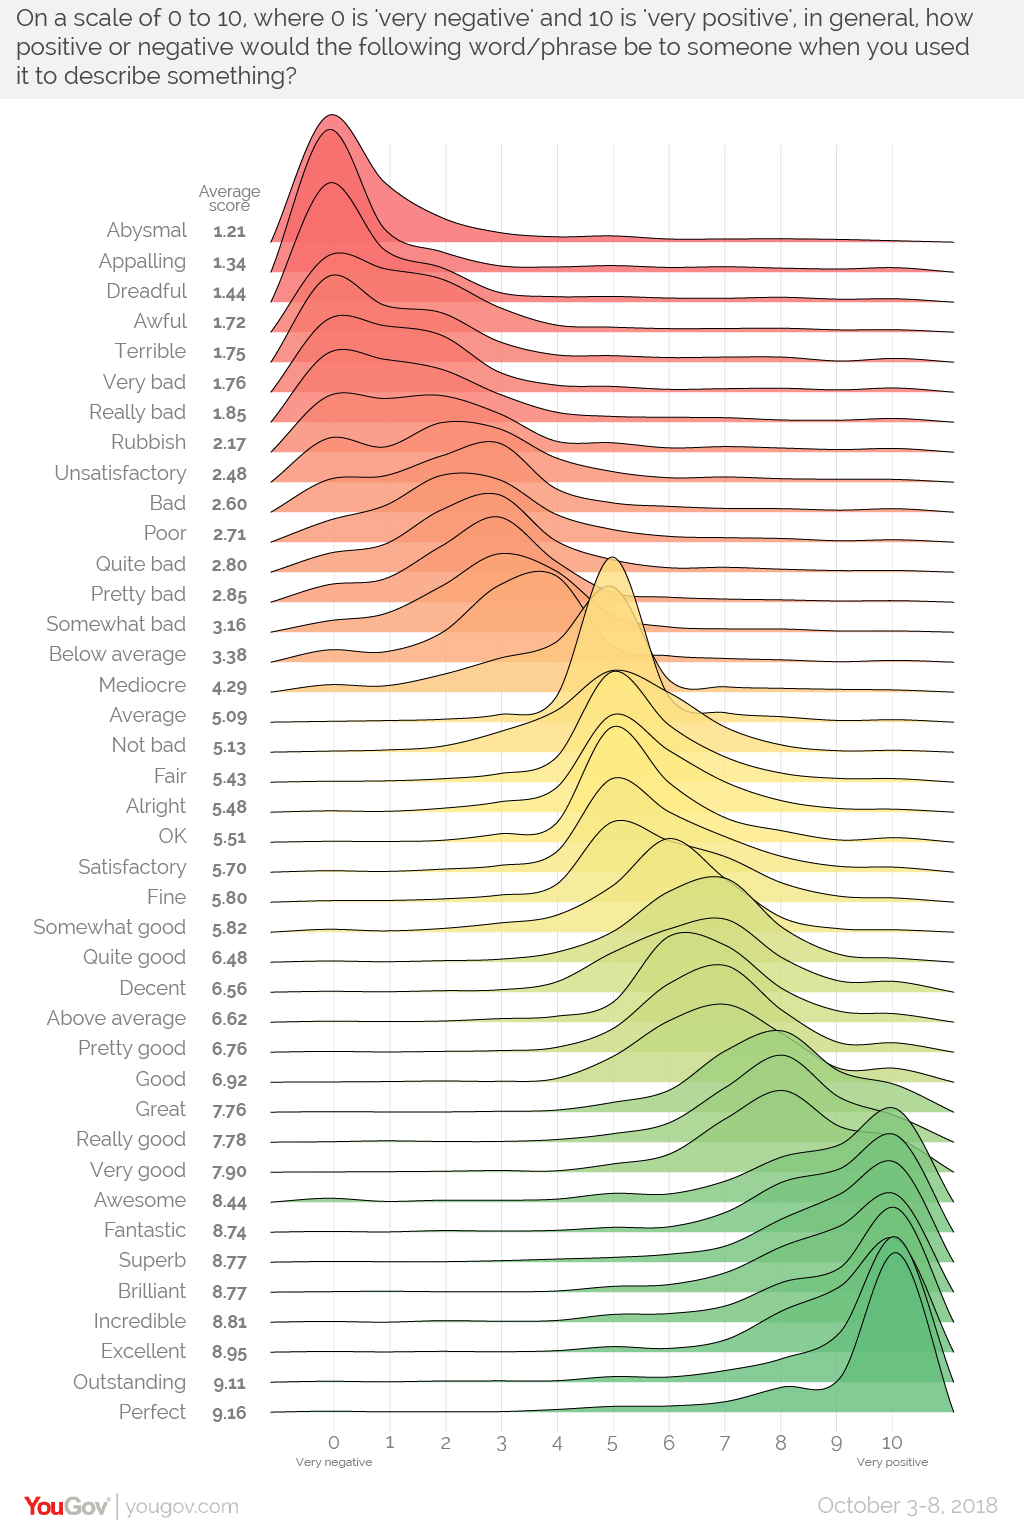
In the U.K. visualization, words have a more defined “hump”, meaning that people tended to agreed on where each word fell on the 10-point scale. As well, there appears to be more mutually agreed upon nuance. The U.S. results showed less agreement on words that weren’t on the extreme ends of the sentiment spectrum.
In both regions, the word average was nearly dead-center on the graph and had the highest percentage of people agreeing on its score.
Quantifying Language
It’s human nature to attempt to tame complexity and bring order to chaos. Language, with its fluidity and openness to interpretation, has always presented a tempting challenge.
To this end, researchers have developed lists that ascribe a sentiment score to specific words. Using data mining techniques, it’s possible to gauge the tone of a piece of writing.
One compelling example of this is a project by data analyst, Susan Li, who ran a sentiment analysis on Warren Buffett’s annual shareholder letters, and found that the majority of the letters had a positive tone.
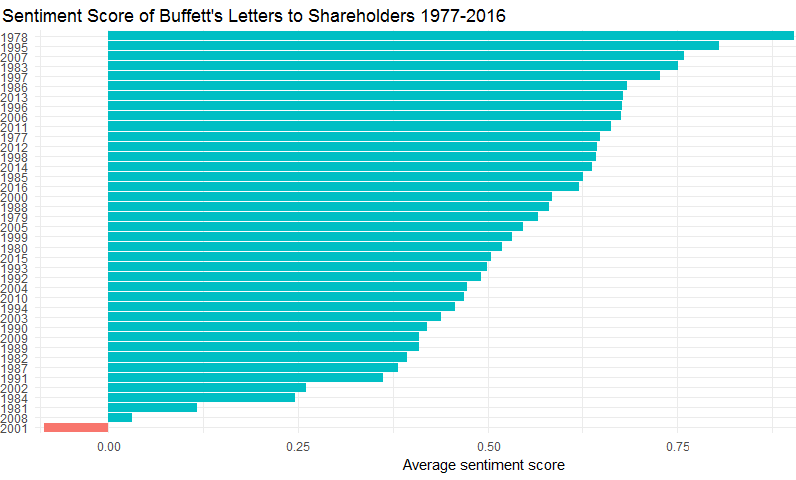
The one outlier? 2001, which was a challenging year for a number of reasons.
As these techniques continue to evolve, we are likely to better understand why one person’s abysmal is another person’s very bad.


Misc
Visualizing the Most Common Pets in the U.S.
Lions, tigers, and bears, oh my!—these animals do not feature on this list of popular American household pets.


Visualizing The Most Common Pets in the U.S.
This was originally posted on our Voronoi app. Download the app for free on iOS or Android and discover incredible data-driven charts from a variety of trusted sources.
In this graphic, we visualized the most common American household pets, based on 2023-2024 data from the American Pet Products Association (accessed via Forbes Advisor).
Figures represent the number of households that own each pet type, rather than the actual number of each animal. The “small animal” category includes hamsters, gerbils, rabbits, guinea pigs, chinchillas, mice, rats, and ferrets.
What is the Most Popular American Household Pet?
Based on this data, dogs—one of the first domesticated animals—are the most common pets in the United States. In fact, around 65 million households own a dog, and spend an average of $900 a year on their care.
| Rank | Species | Households |
|---|---|---|
| 1 | 🐶 Dog | 65M |
| 2 | 🐱 Cat | 47M |
| 3 | 🐟 Freshwater Fish | 11M |
| 4 | 🐰 Small Animals | 7M |
| 5 | 🐦 Bird | 6M |
| 6 | 🦎 Reptile | 6M |
| 7 | 🐴 Horse | 2M |
| 8 | 🐠 Saltwater Fish | 2M |
Note: Households can own multiple pets, and are counted for all relevant categories.
Cats rank second, at 47 million households, and these smaller felines are a little less expensive to own at $700/year according to Forbes estimates.
But aside from these two juggernauts, there are plenty of other common pet types found in households across the country.
Freshwater fish can be found in 11 million households, along with small animals—rabbits, hamsters, guinea pigs—in 7 million. Meanwhile, nearly 6 million homes have birds or reptiles.
Pet Ownership is on the Rise in America
Forbes found that 66% of all American households (numbering 87 million) own at least one pet, up from 56% in 1988. One third of these (29 million) own multiple pets.
A combination of factors is driving this increase: rising incomes, delayed childbirth, and of course the impact of the pandemic which nearly cleared out animal shelters across the globe.
America’s loneliness epidemic may also be a factor. Fledgling research has shown that single-individual households with pets recorded lower rates of loneliness during the pandemic than those without a pet.

-

 Science1 week ago
Visualizing the Average Lifespans of Mammals
-

 Demographics2 weeks ago
The Smallest Gender Wage Gaps in OECD Countries
-

 United States2 weeks ago
Where U.S. Inflation Hit the Hardest in March 2024
-

 Green2 weeks ago
Top Countries By Forest Growth Since 2001
-

 United States2 weeks ago
Ranked: The Largest U.S. Corporations by Number of Employees
-

 Maps2 weeks ago
The Largest Earthquakes in the New York Area (1970-2024)
-

 Green2 weeks ago
Ranked: The Countries With the Most Air Pollution in 2023
-

 Green2 weeks ago
Ranking the Top 15 Countries by Carbon Tax Revenue